![]()
Geotechnical, environmental and geomechanical data management software
Why choose Geotec?
Benefit from a centralized corporate database. Geotec’s table hierarchy is set up to support unlimited number of projects in a single corporate database. Geotec’s capabilities are developed for SQL Server, MySQL, Oracle, MS Access, and SQLite databases. View, manage and analyze current and past projects all from a single source.
- Save everything from raw data to design parameters
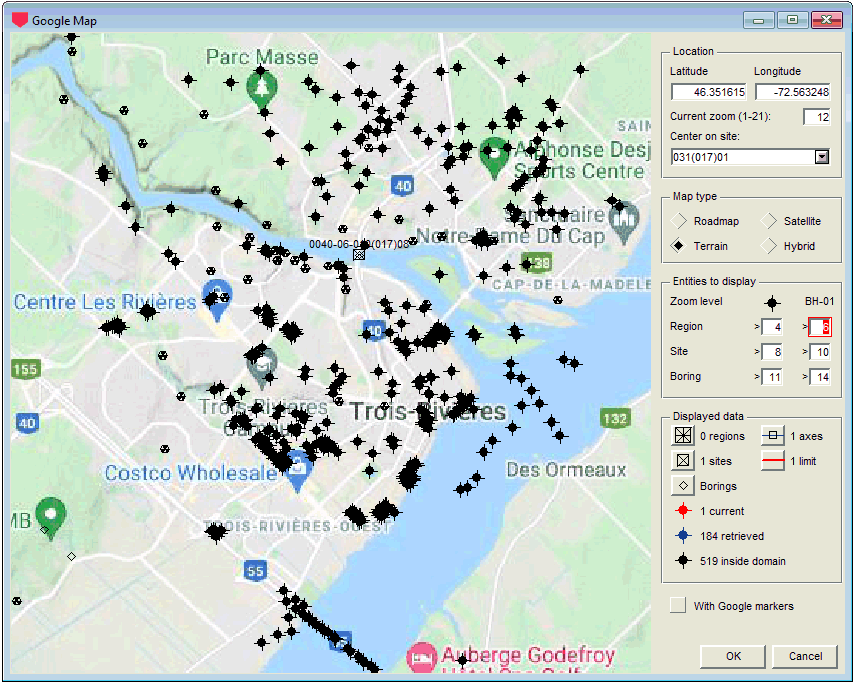
- Integrated Google Maps with location of borings and sites
- Data entry forms and calculations
- Modify the design of graphic reports based on company standards and project needs
- Quick search of information in the database
- Bilingual software (English and French)
- Integration into any project workflow thanks to its compatibility with multiple data formats.


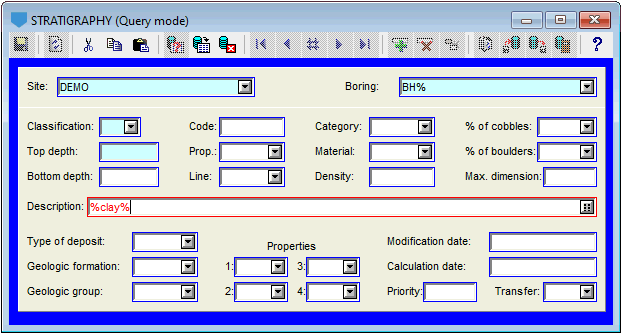
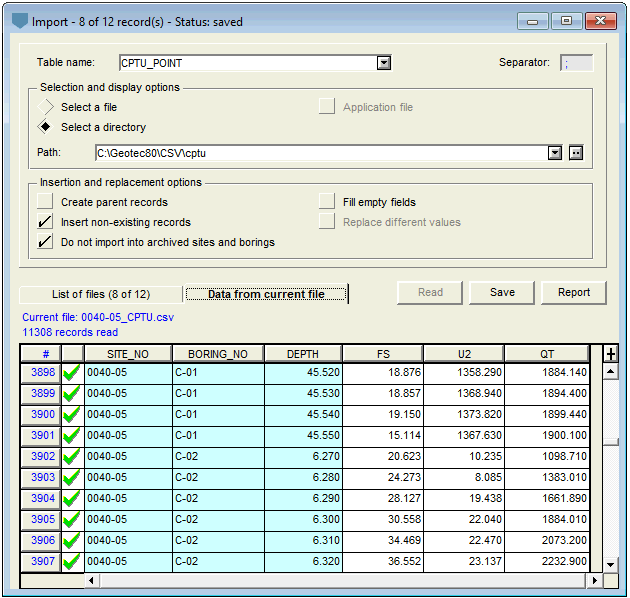
Data entry forms and calculations
The entry forms are available in all Geotec modules – to enter, manage, modify, view and calculate data. The data is saved in the database and can be presented in any type of report.
- Many integrated calculations
- Entry and display of length and depth units in meters, feet, inches or centimeters
- Customizable drop-down lists
- Search for data with simple or elaborate criteria

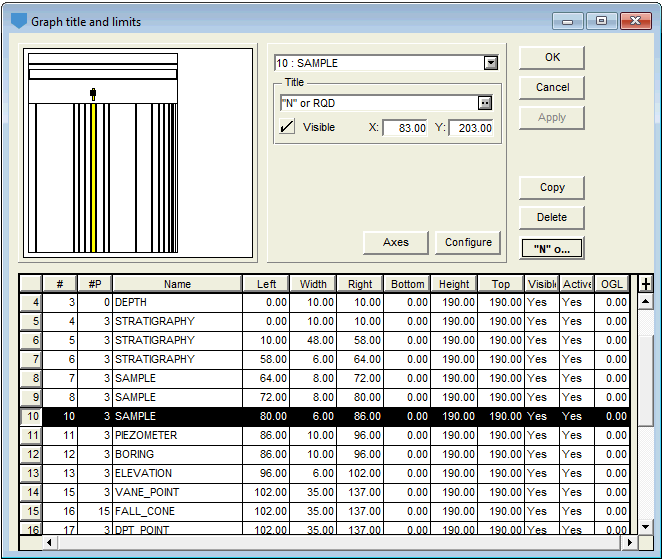
Design of graphic outputs
The graphic presentations are independent from data. Saved as style files, they can be reused for any project. Geotec allows you to adjust the design of your reports to reflect company standards and project needs.
- Customization of the columns linked to specific fields of the database
- Graphs for laboratory tests
- Tables linked to multiple fields of the database
- Editing of graphics dimensions and headings
- Data presented as texts, histograms, steps, polylines, points, colors, patterns, …
- Linear, logarithmic or temporal axes with limits, grids, tick marks, labels, …
![]() To preview examples of graphic outputs…
To preview examples of graphic outputs…

Interaction between modules
Geotec modules are all connected to the corporate database. The interaction between the modules allows you to optimize your work including the collection, reports, management, visualization and analysis of the various projects.
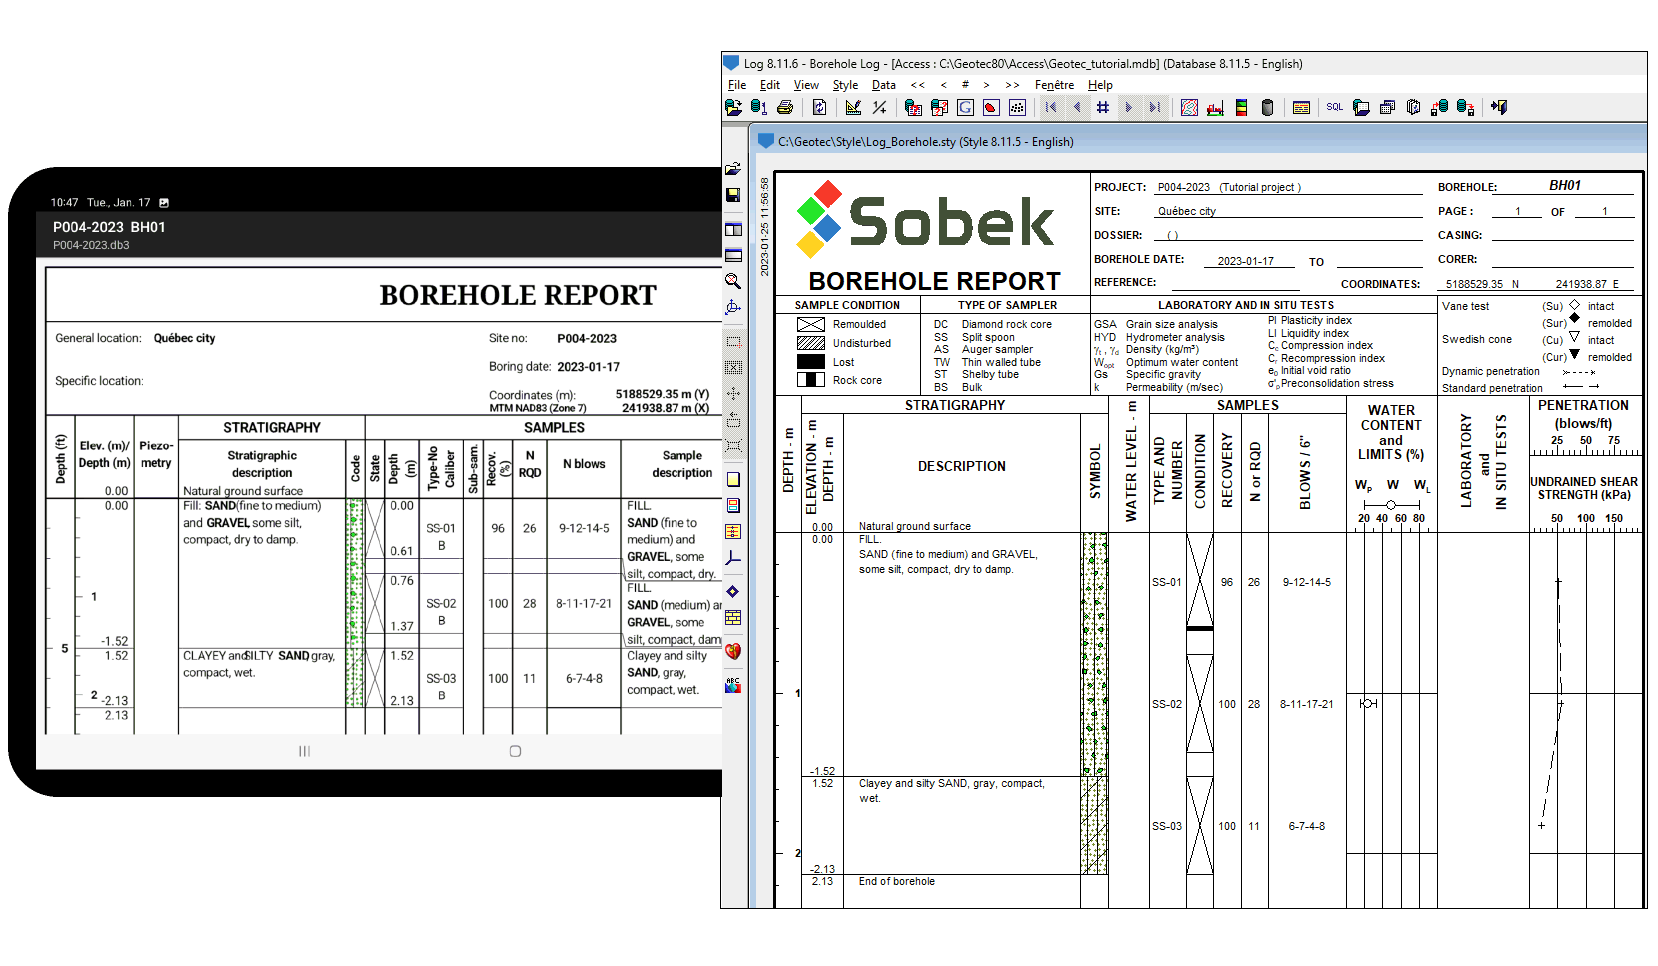
Geotab with Log
Collect borehole data on the field via Geotab then view and complete the borehole reports at the office via Log.
Lab with Log, Pro and Site
Enter lab measurements to calculate test results and produce reports via Lab. Present these results in boring reports in Log, profile views in Pro or 3D in Site.
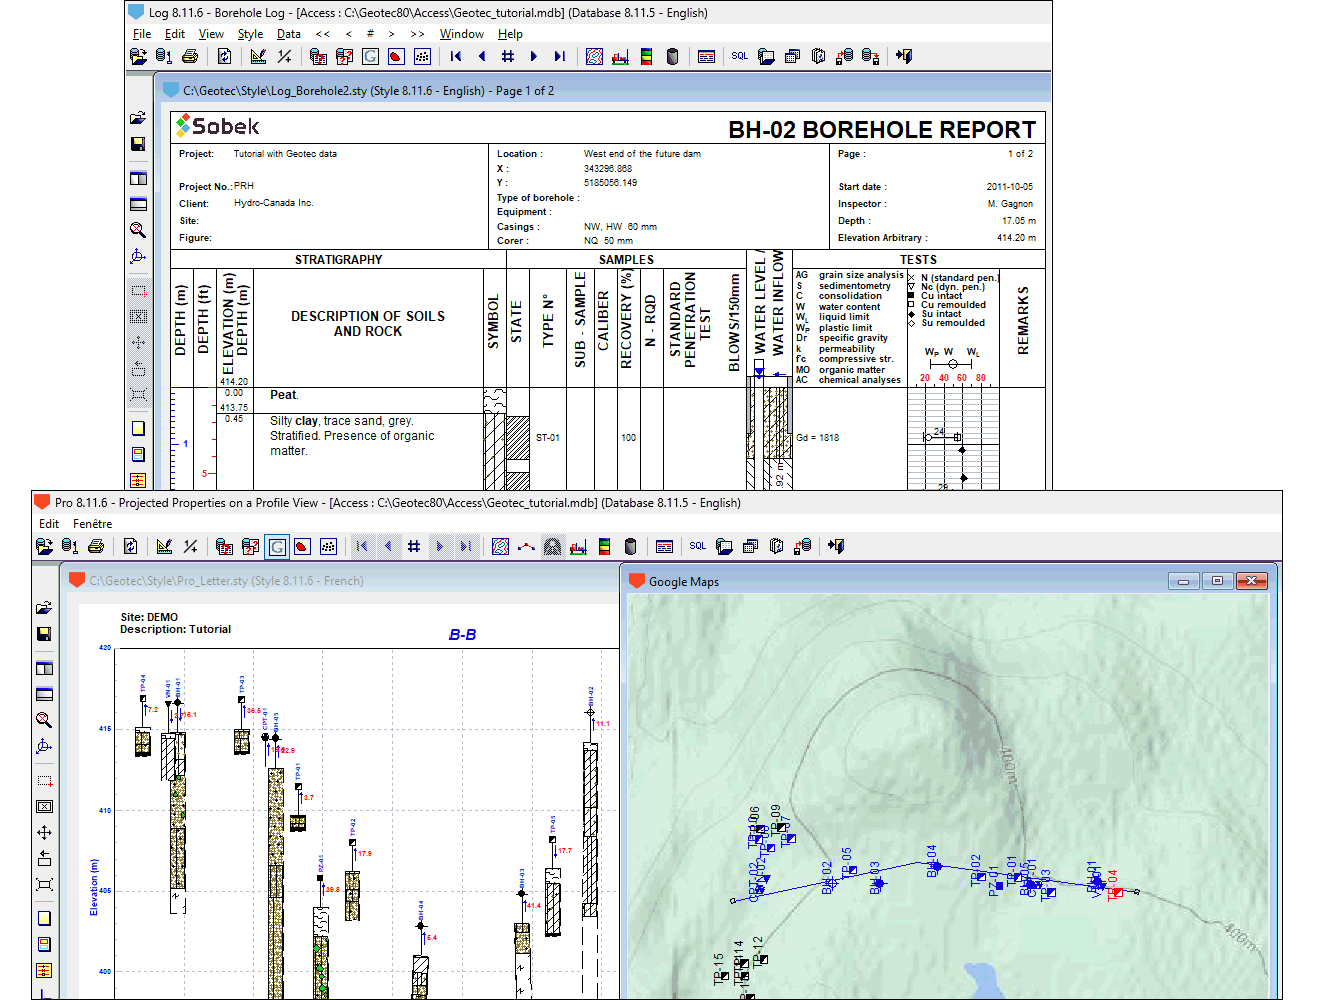
Log with Pro and Site
Produce the boring reports, then analyze the data via cross-sections. Use GIS tools to visualize projects and create other profile views.

Geotec modules
The Geotec suite includes the Geotab field data entry app, five graphic modules and a complementary database management module.
Geotab
Field application for data entry
LOG
Borehole reports
LAB
Laboratory tests
PRO
Profile views
SITE
Visualization on a plan view
TIME
Geotechnical instrumentation
DBM
Database management