![]()
Profile views and cross-sections
Visualize and analyze your data
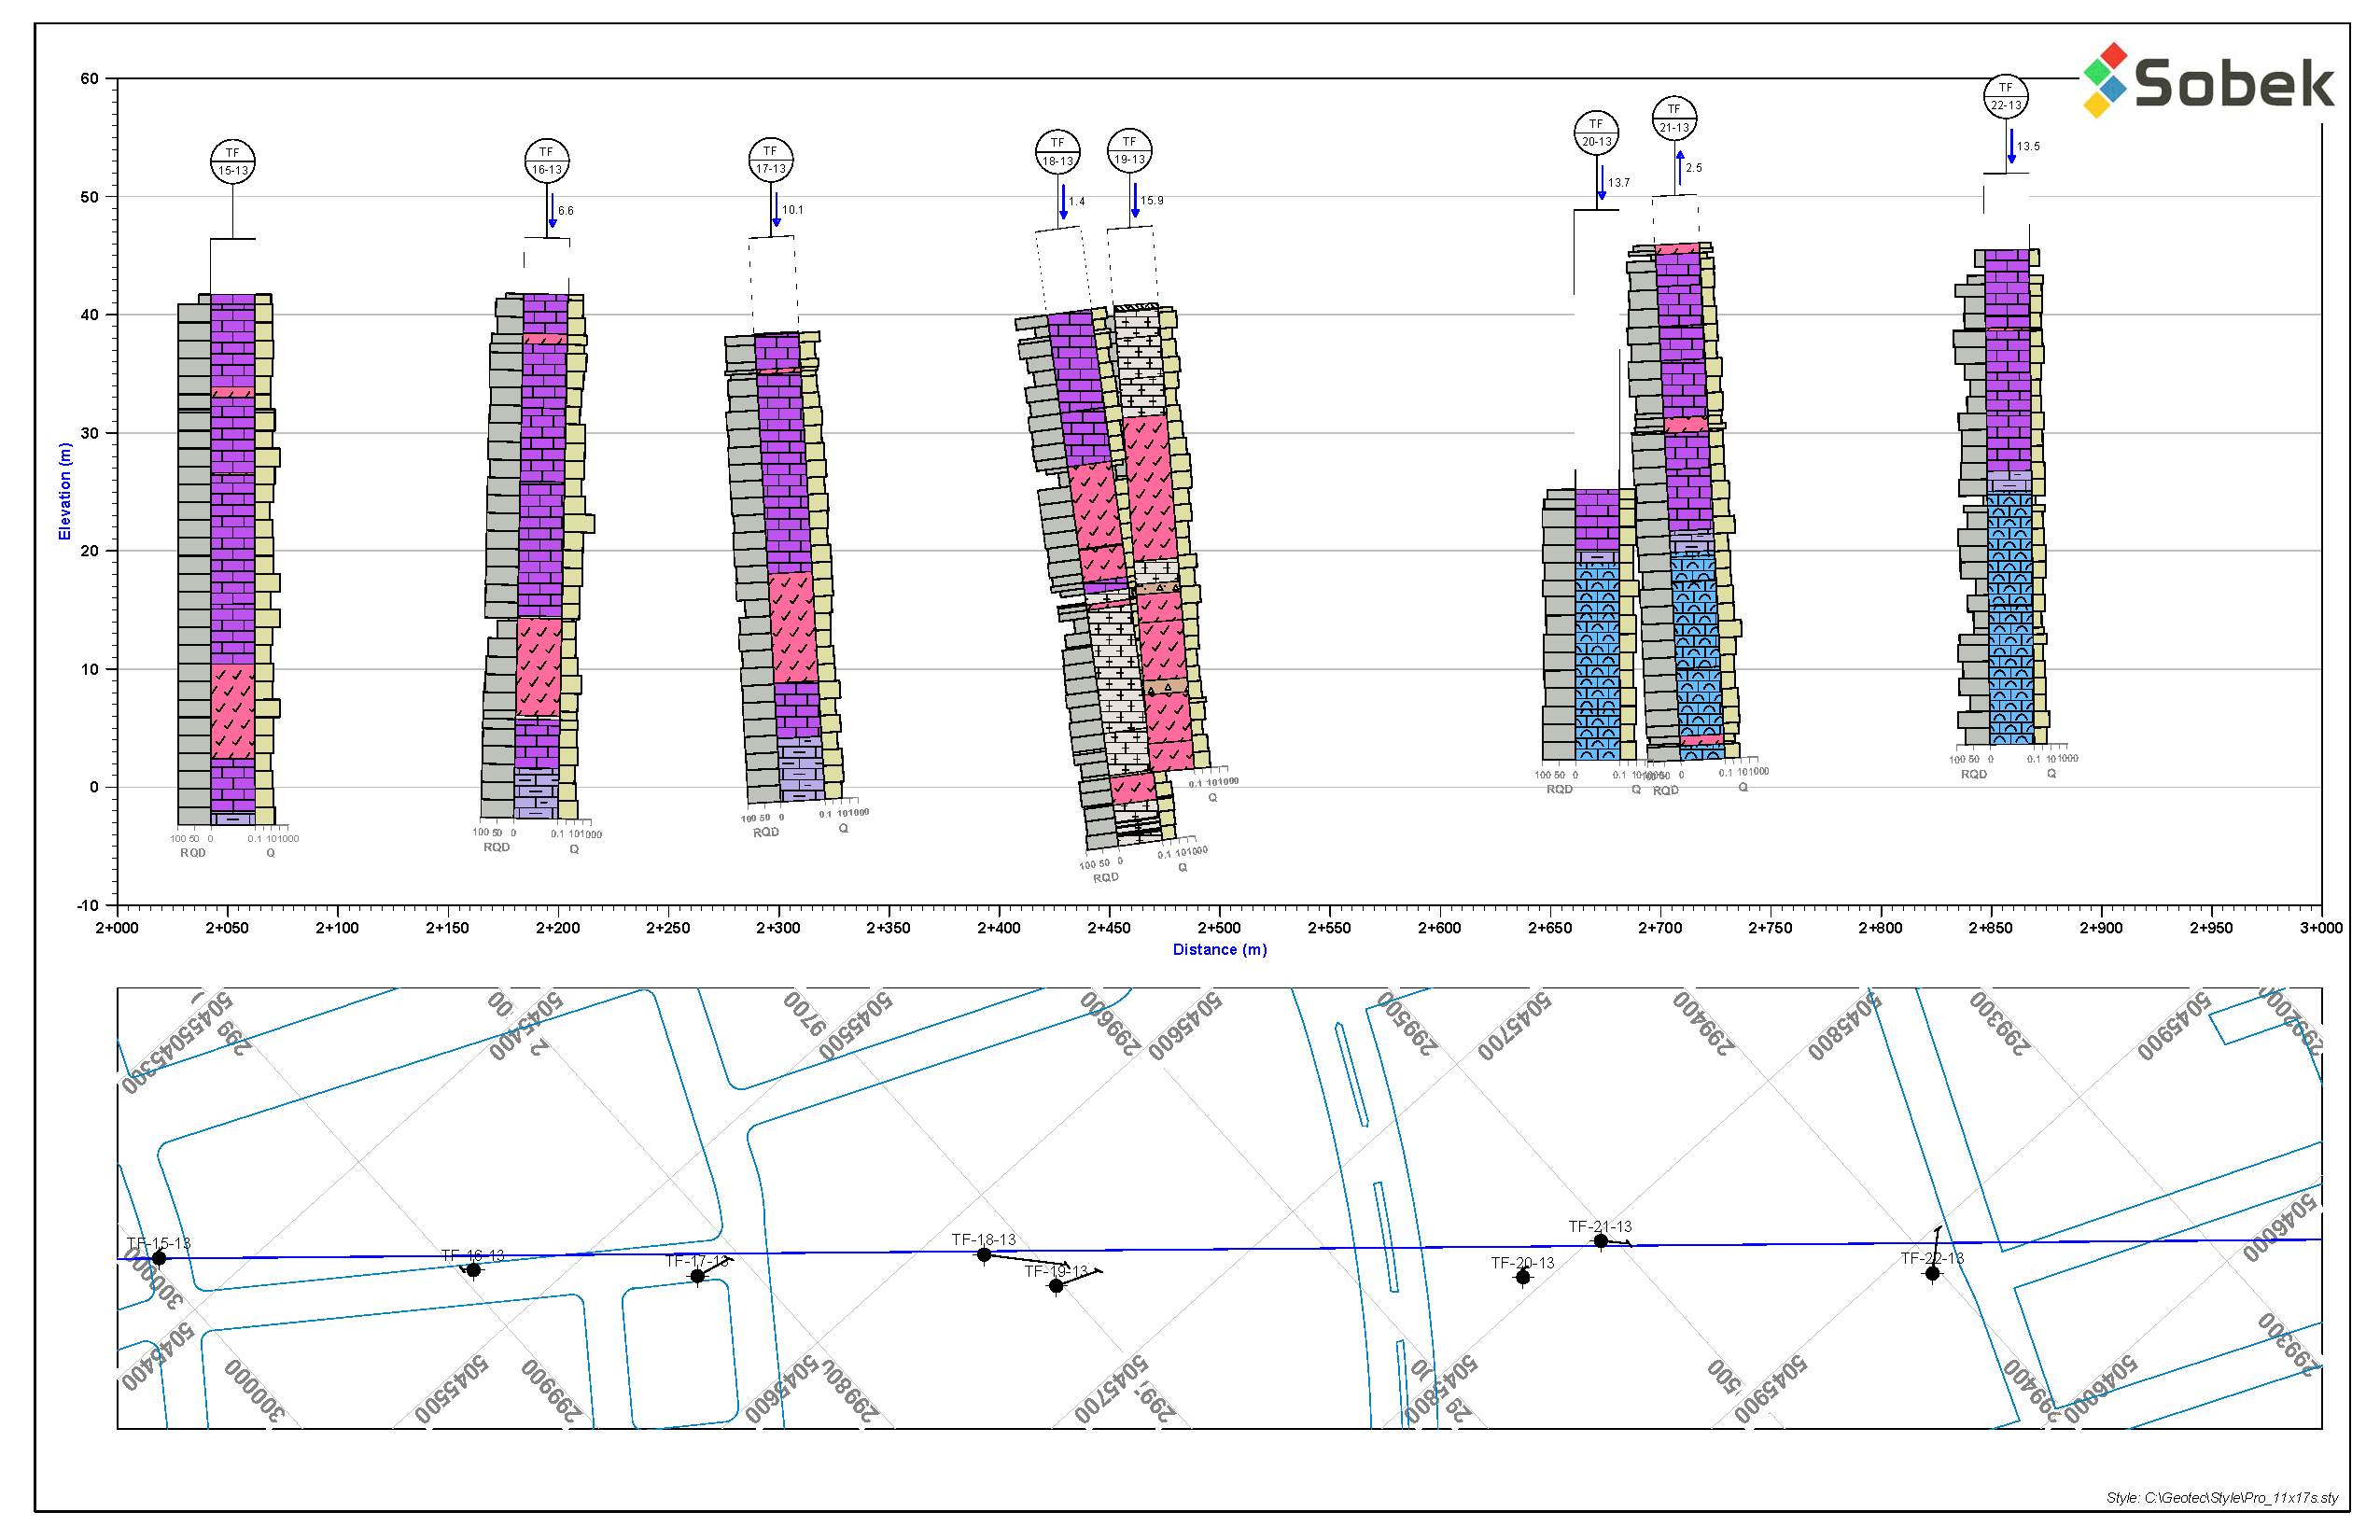
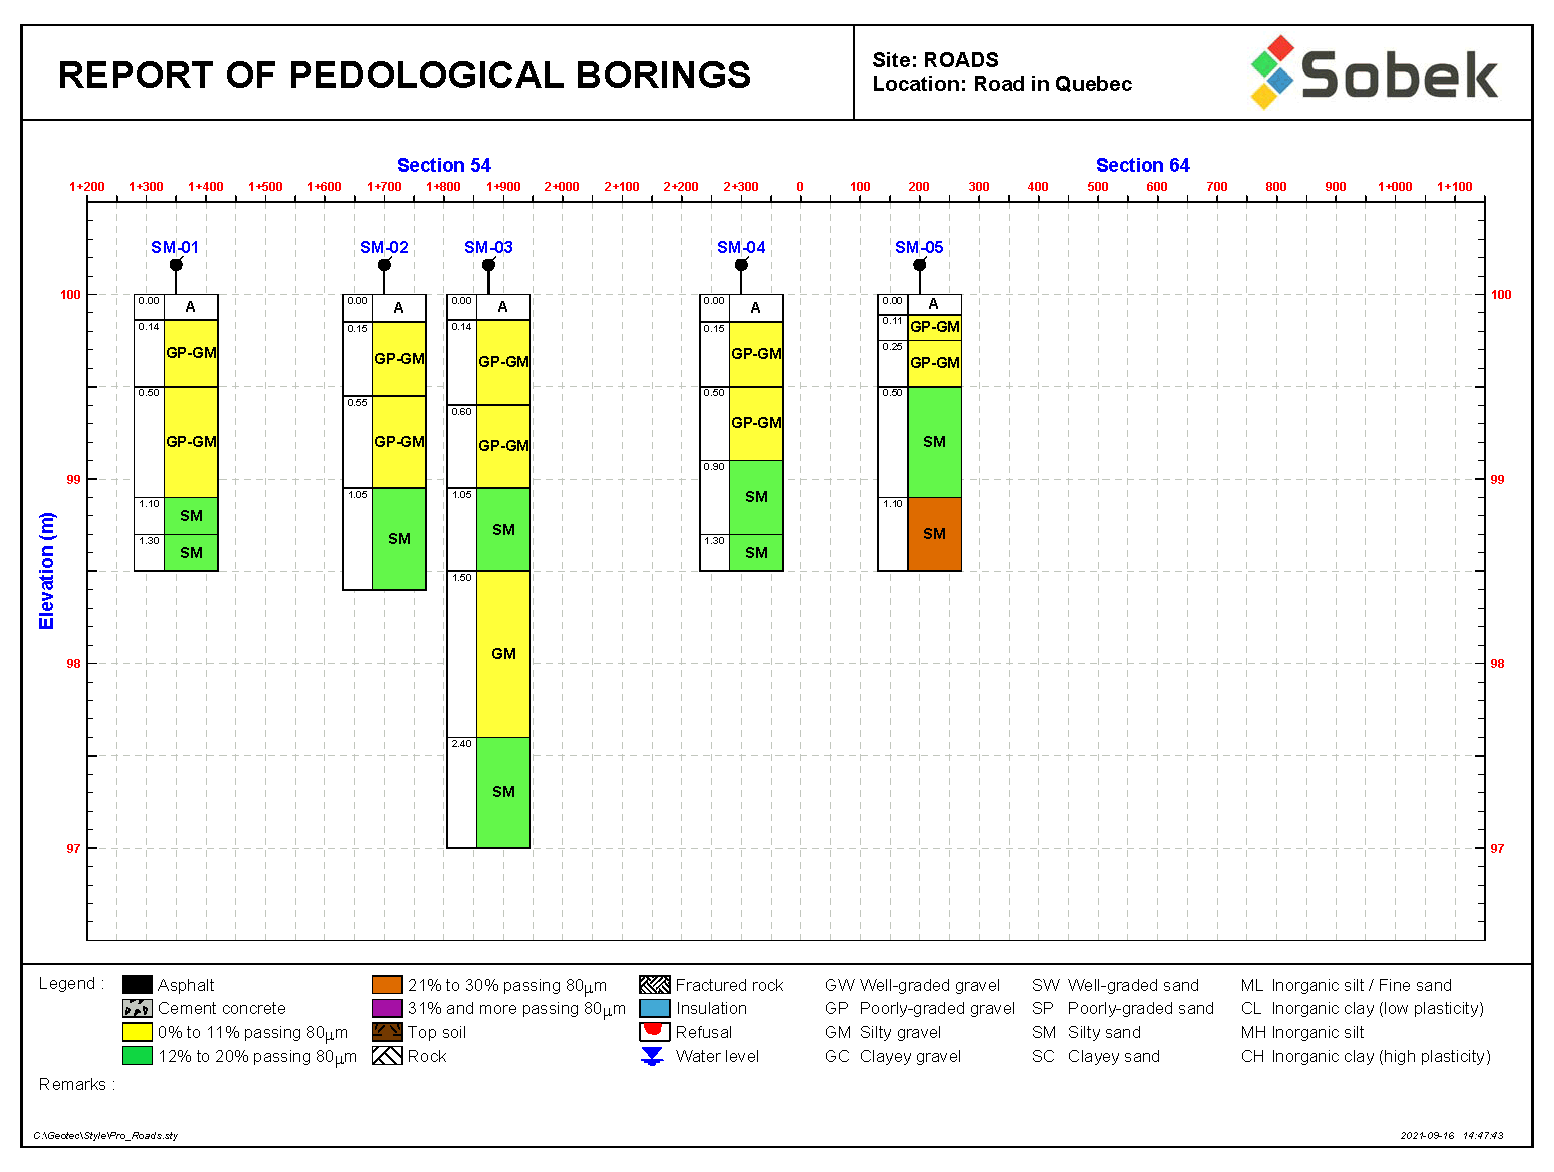
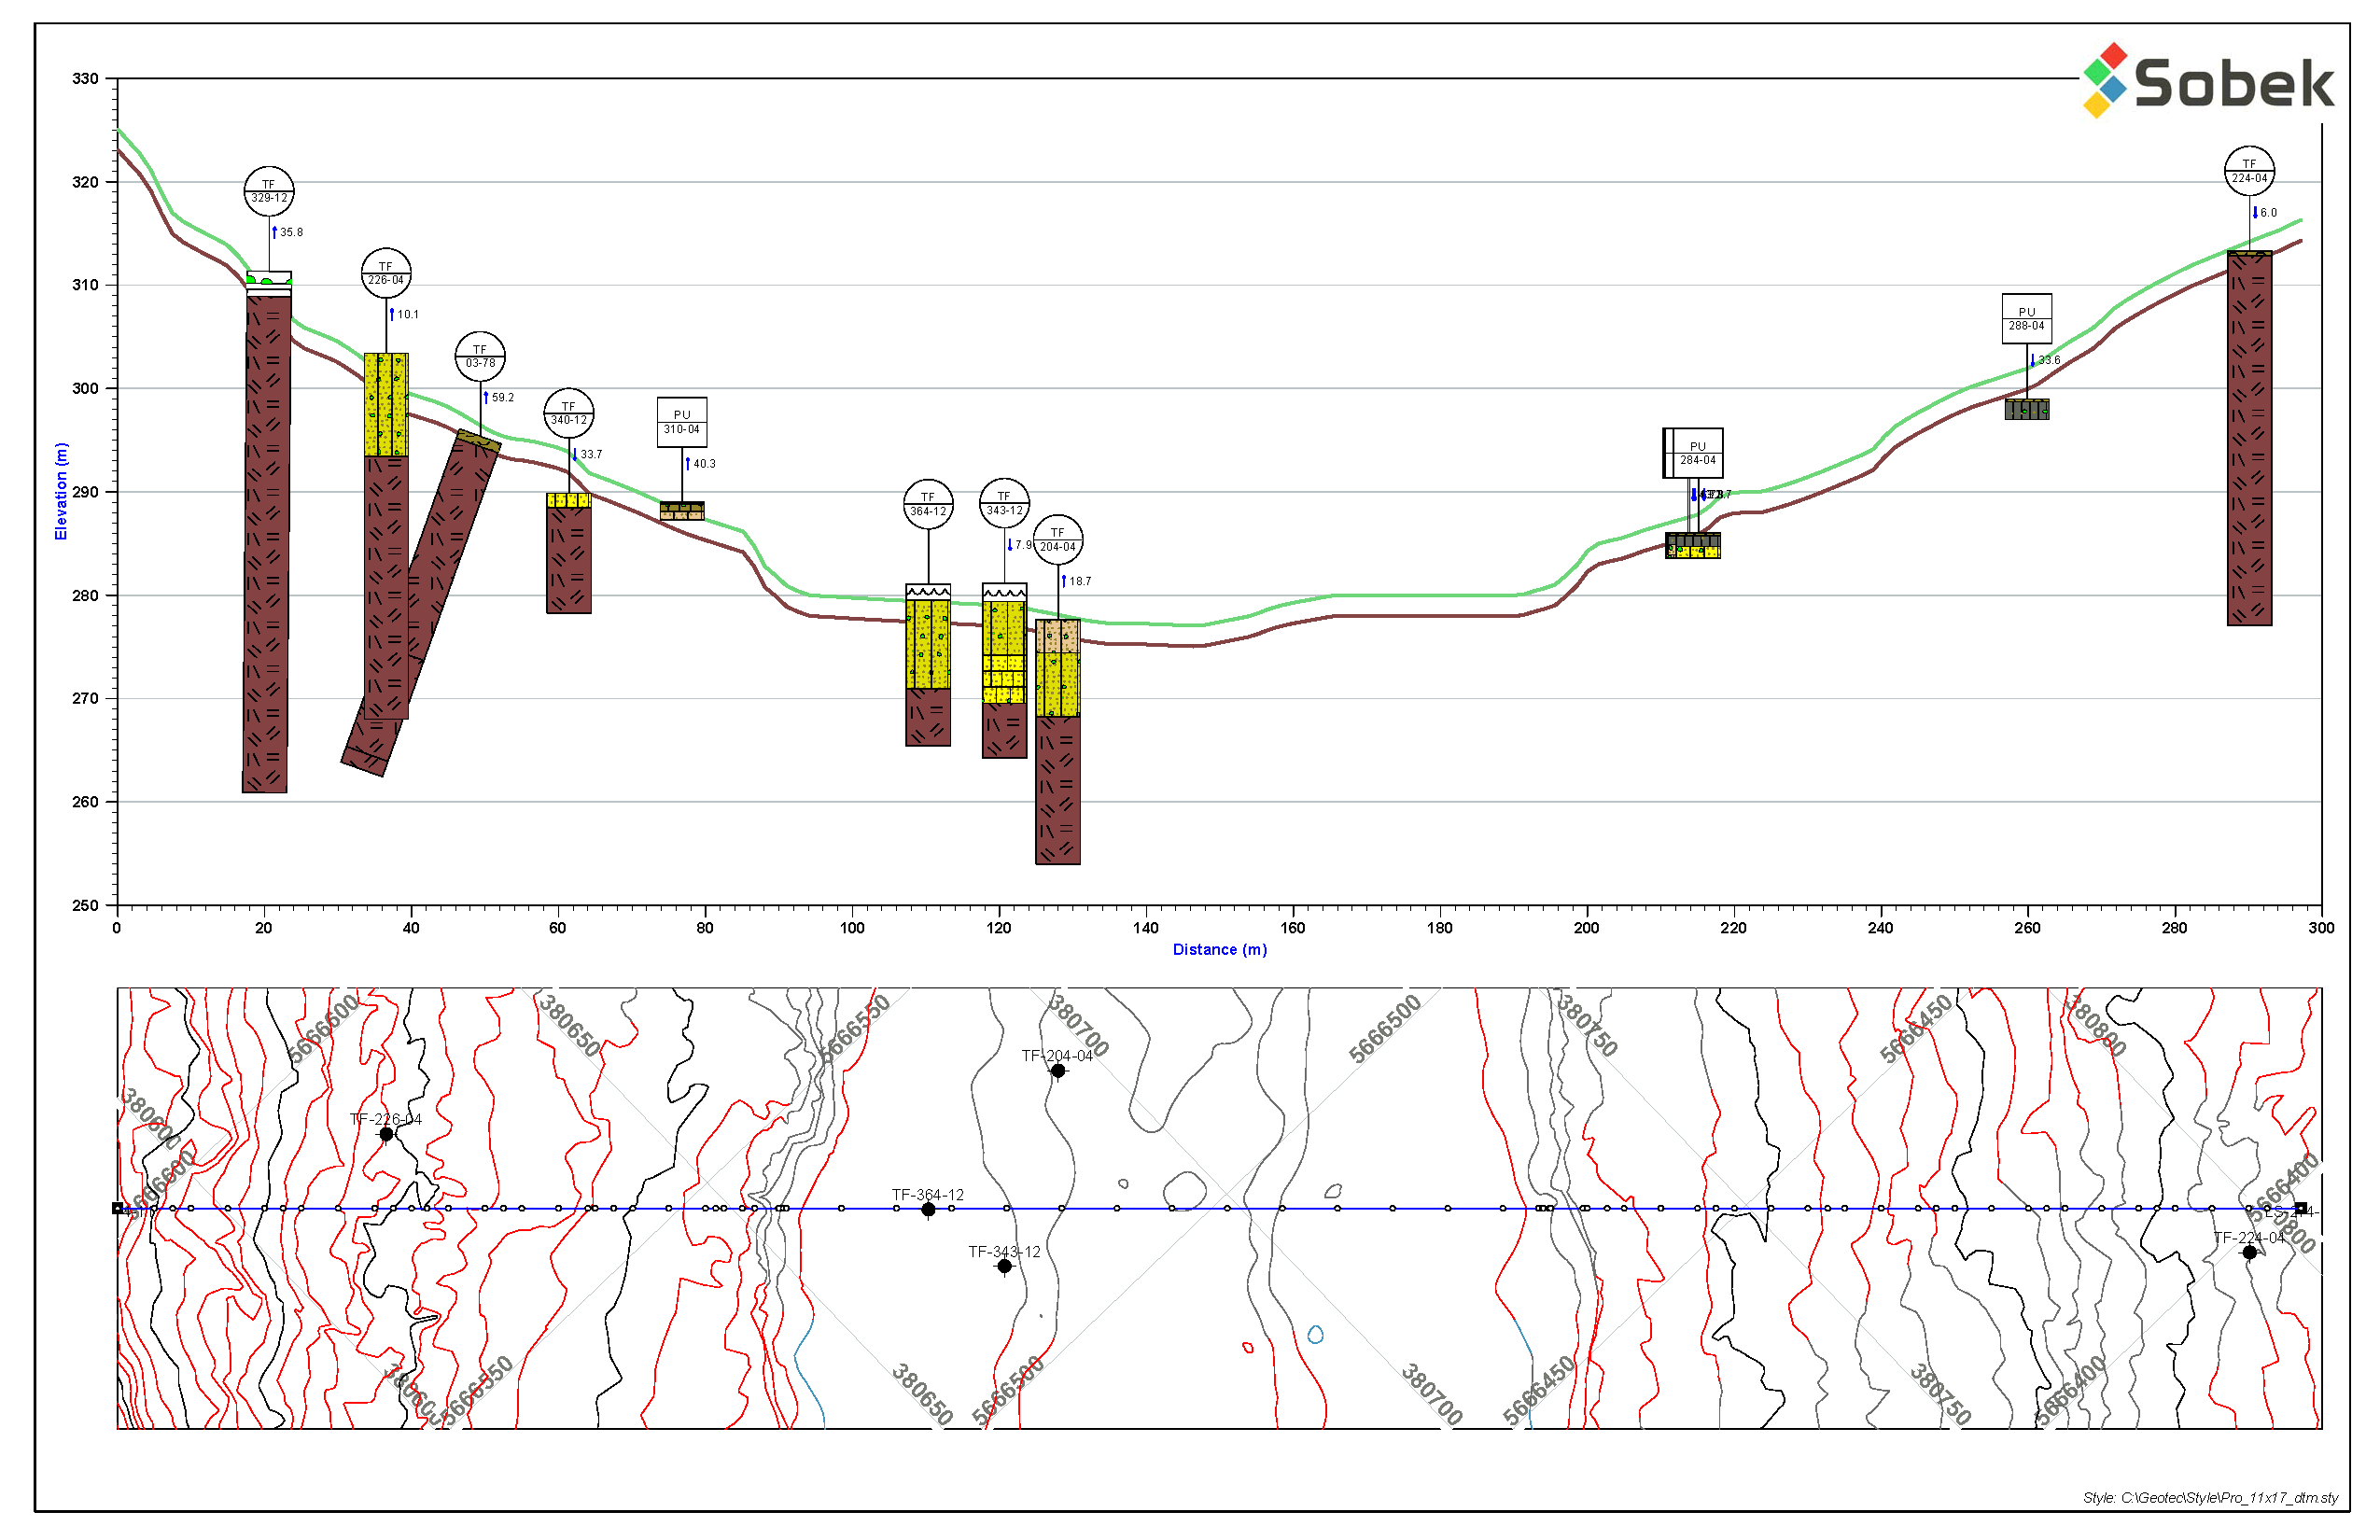
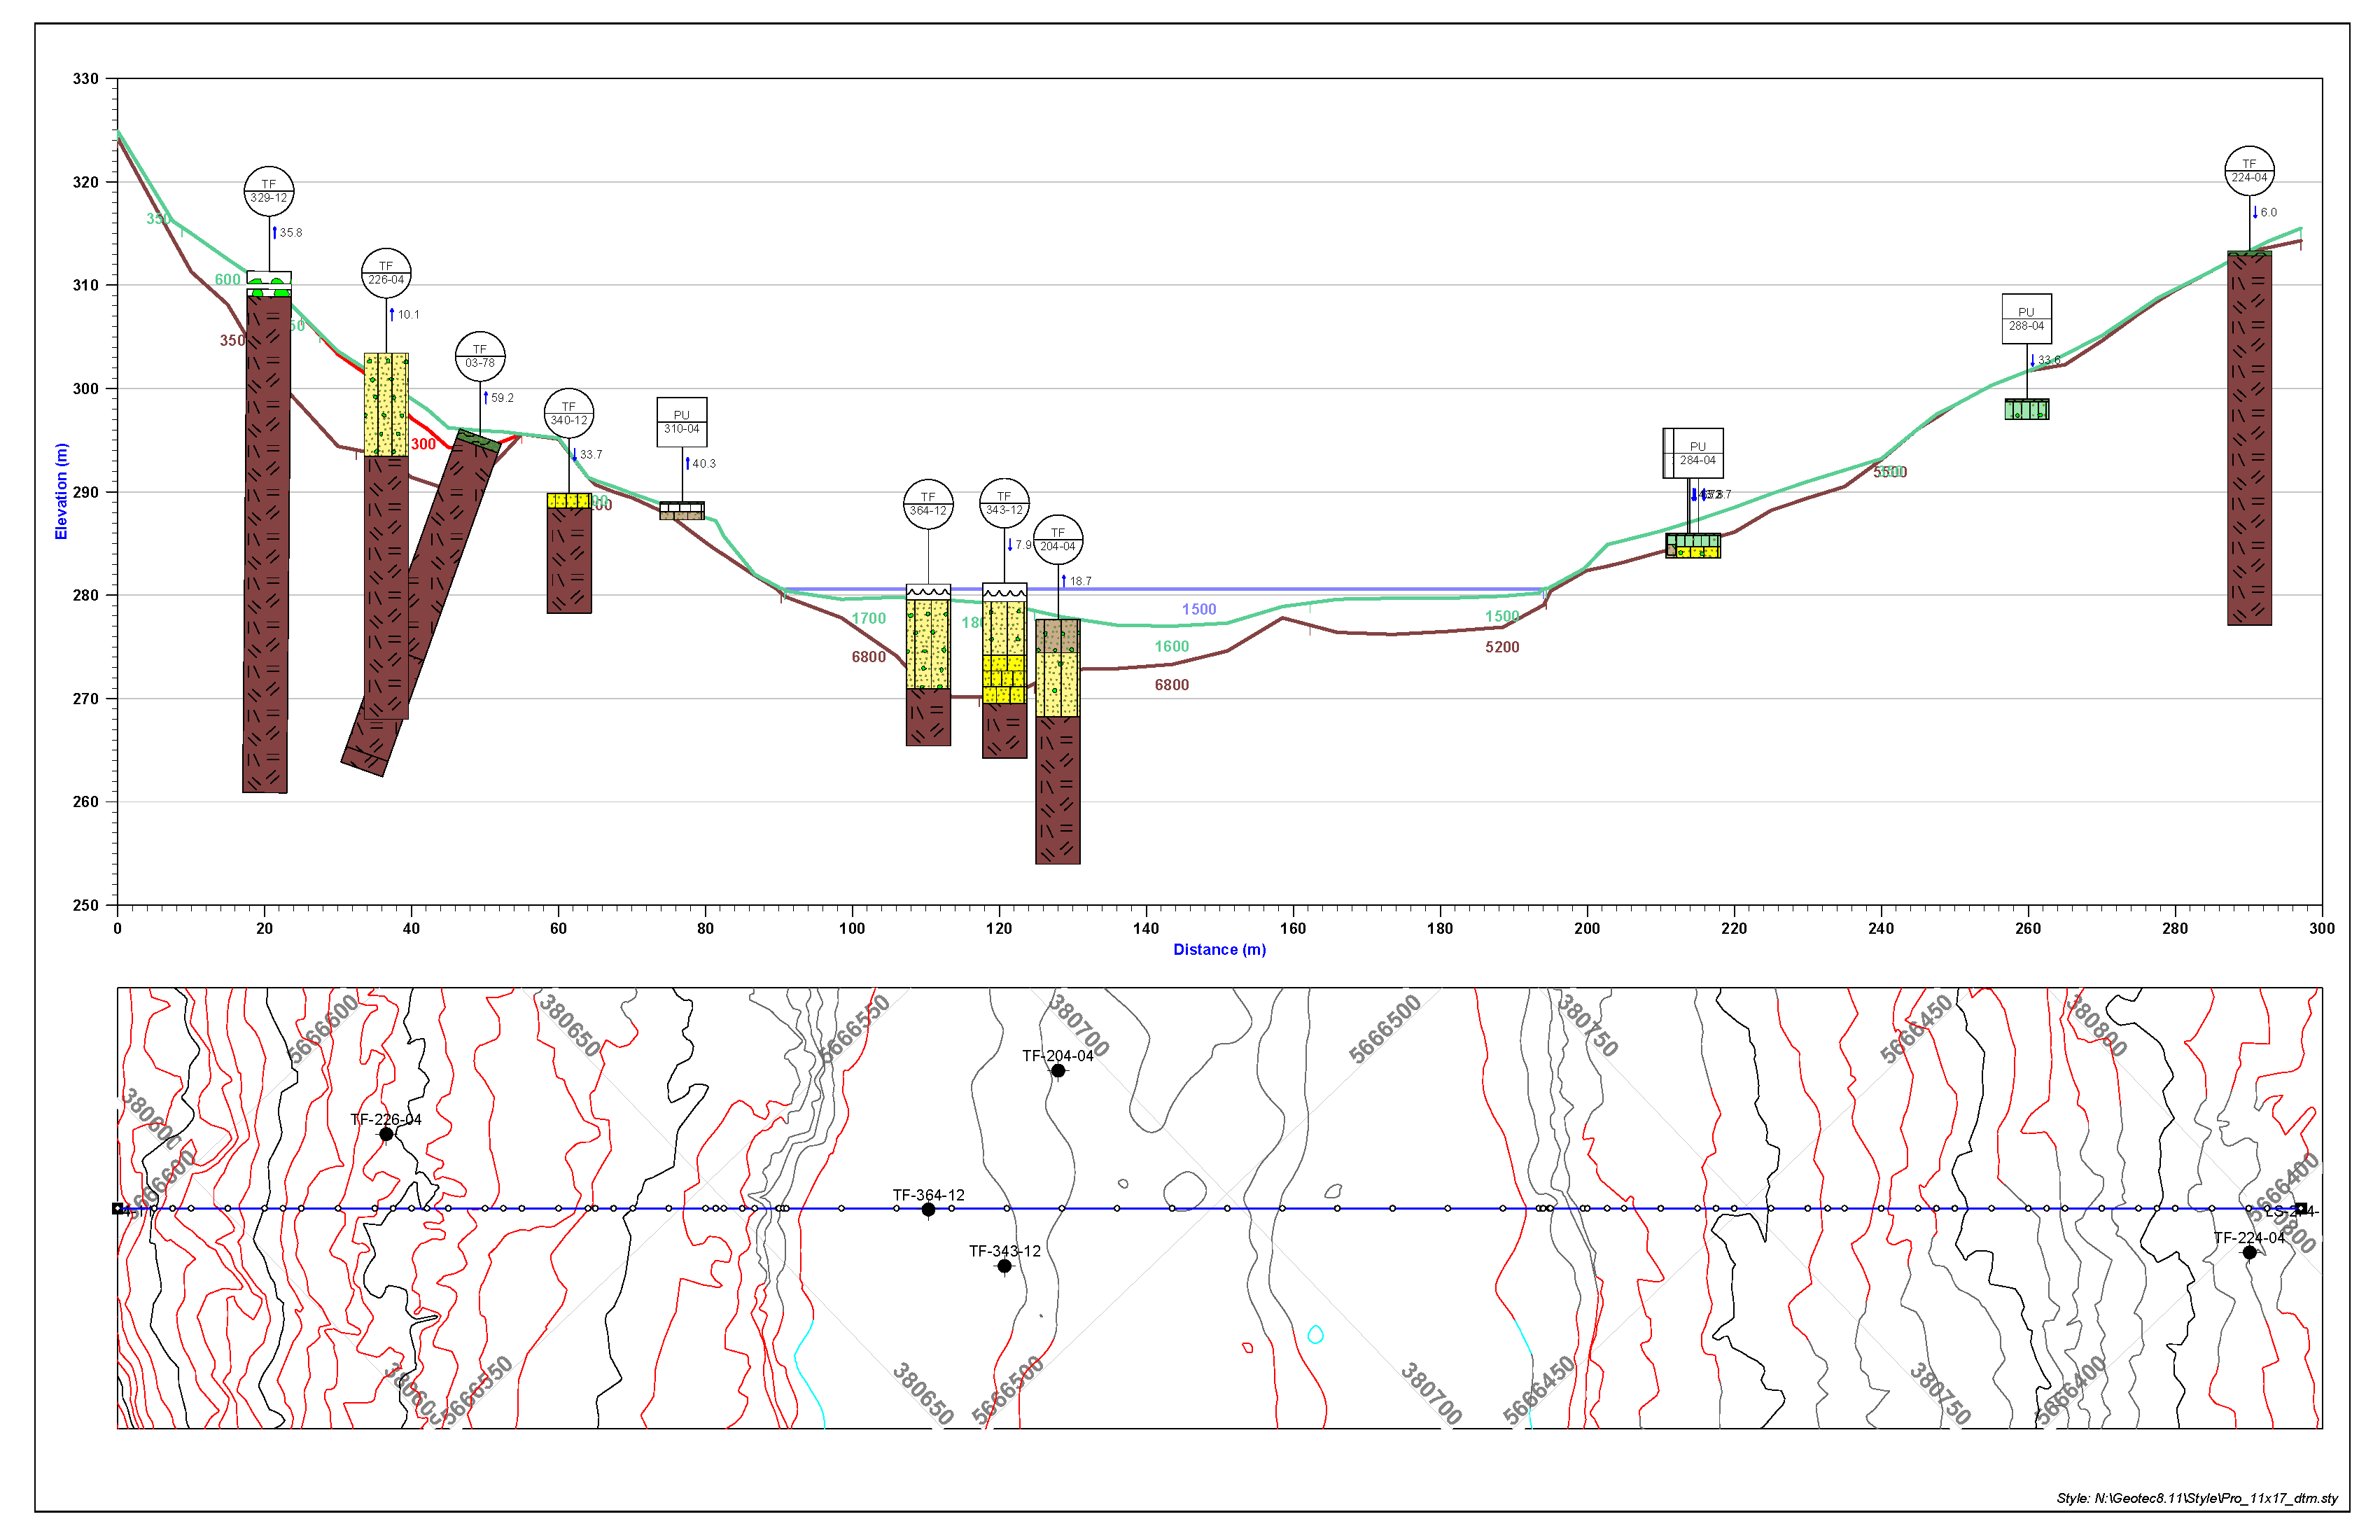
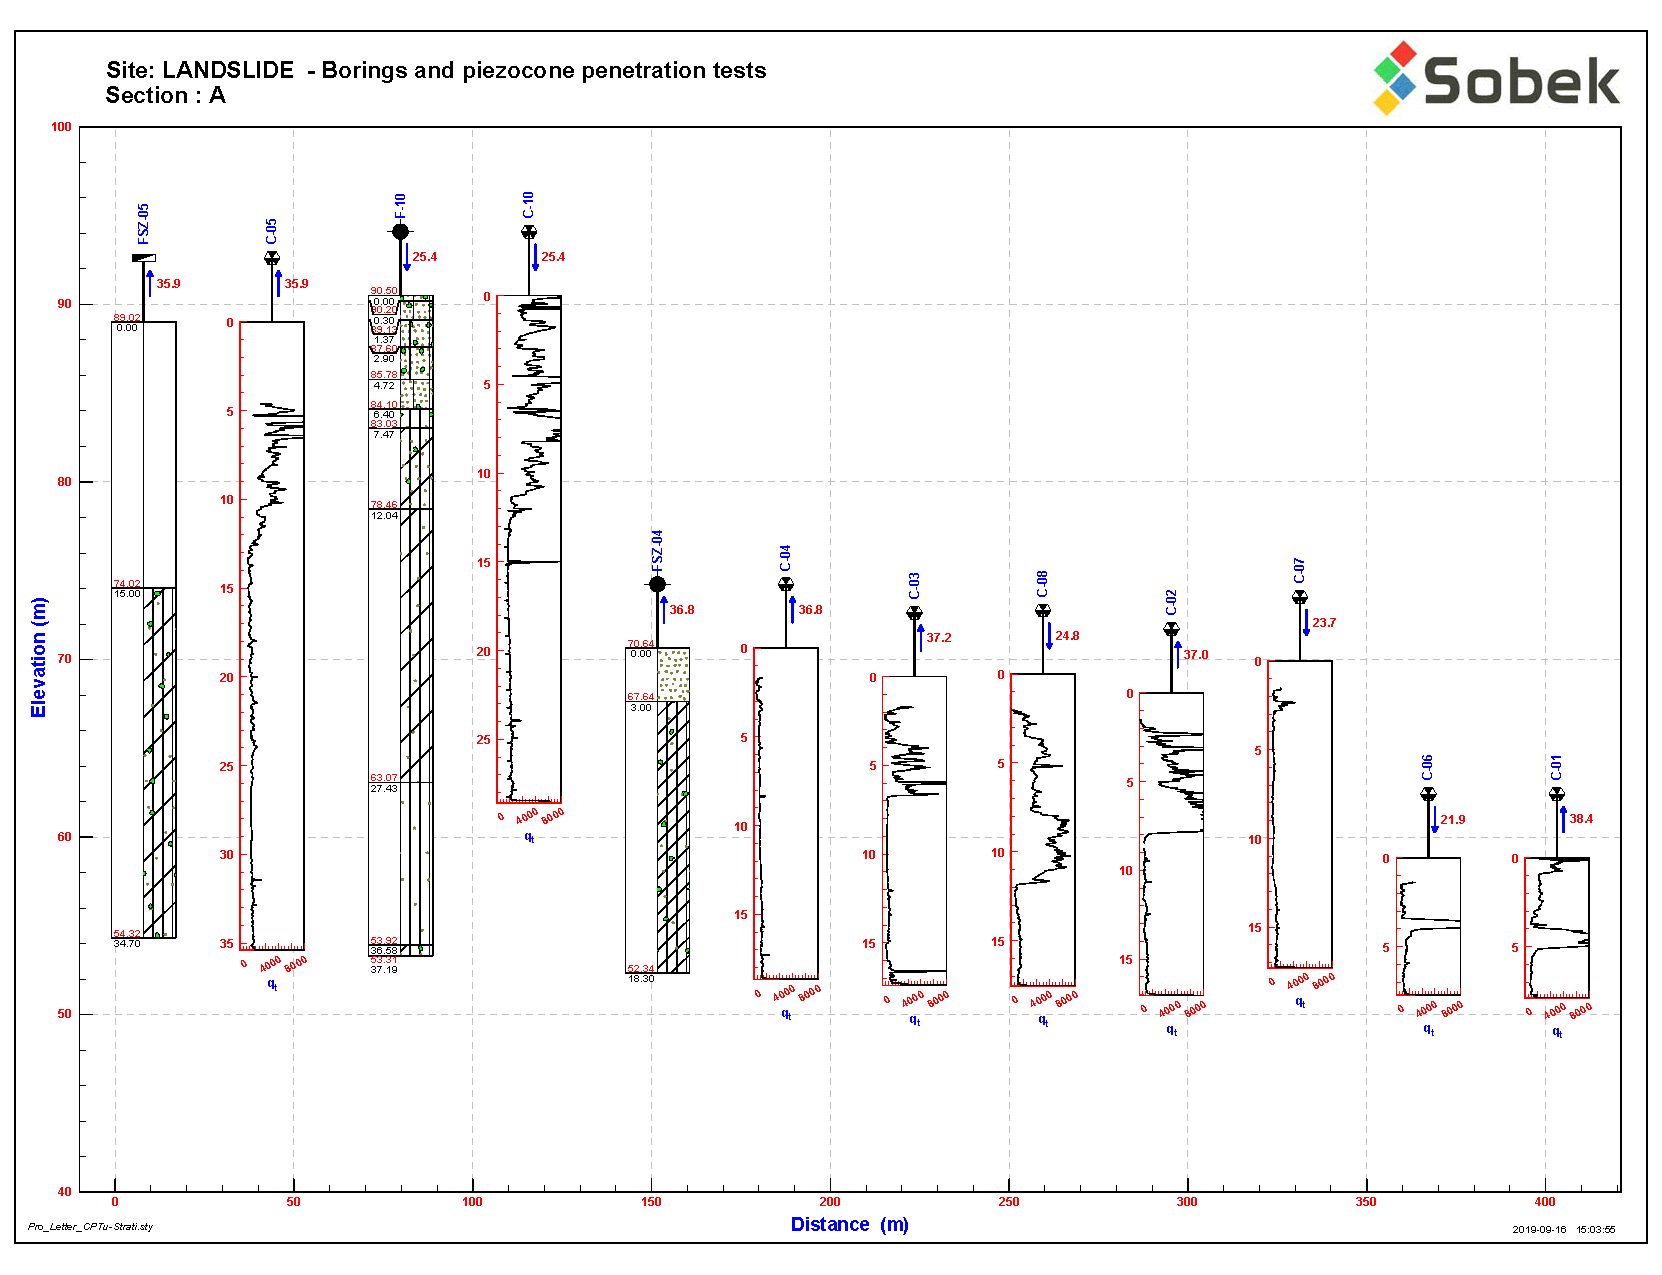
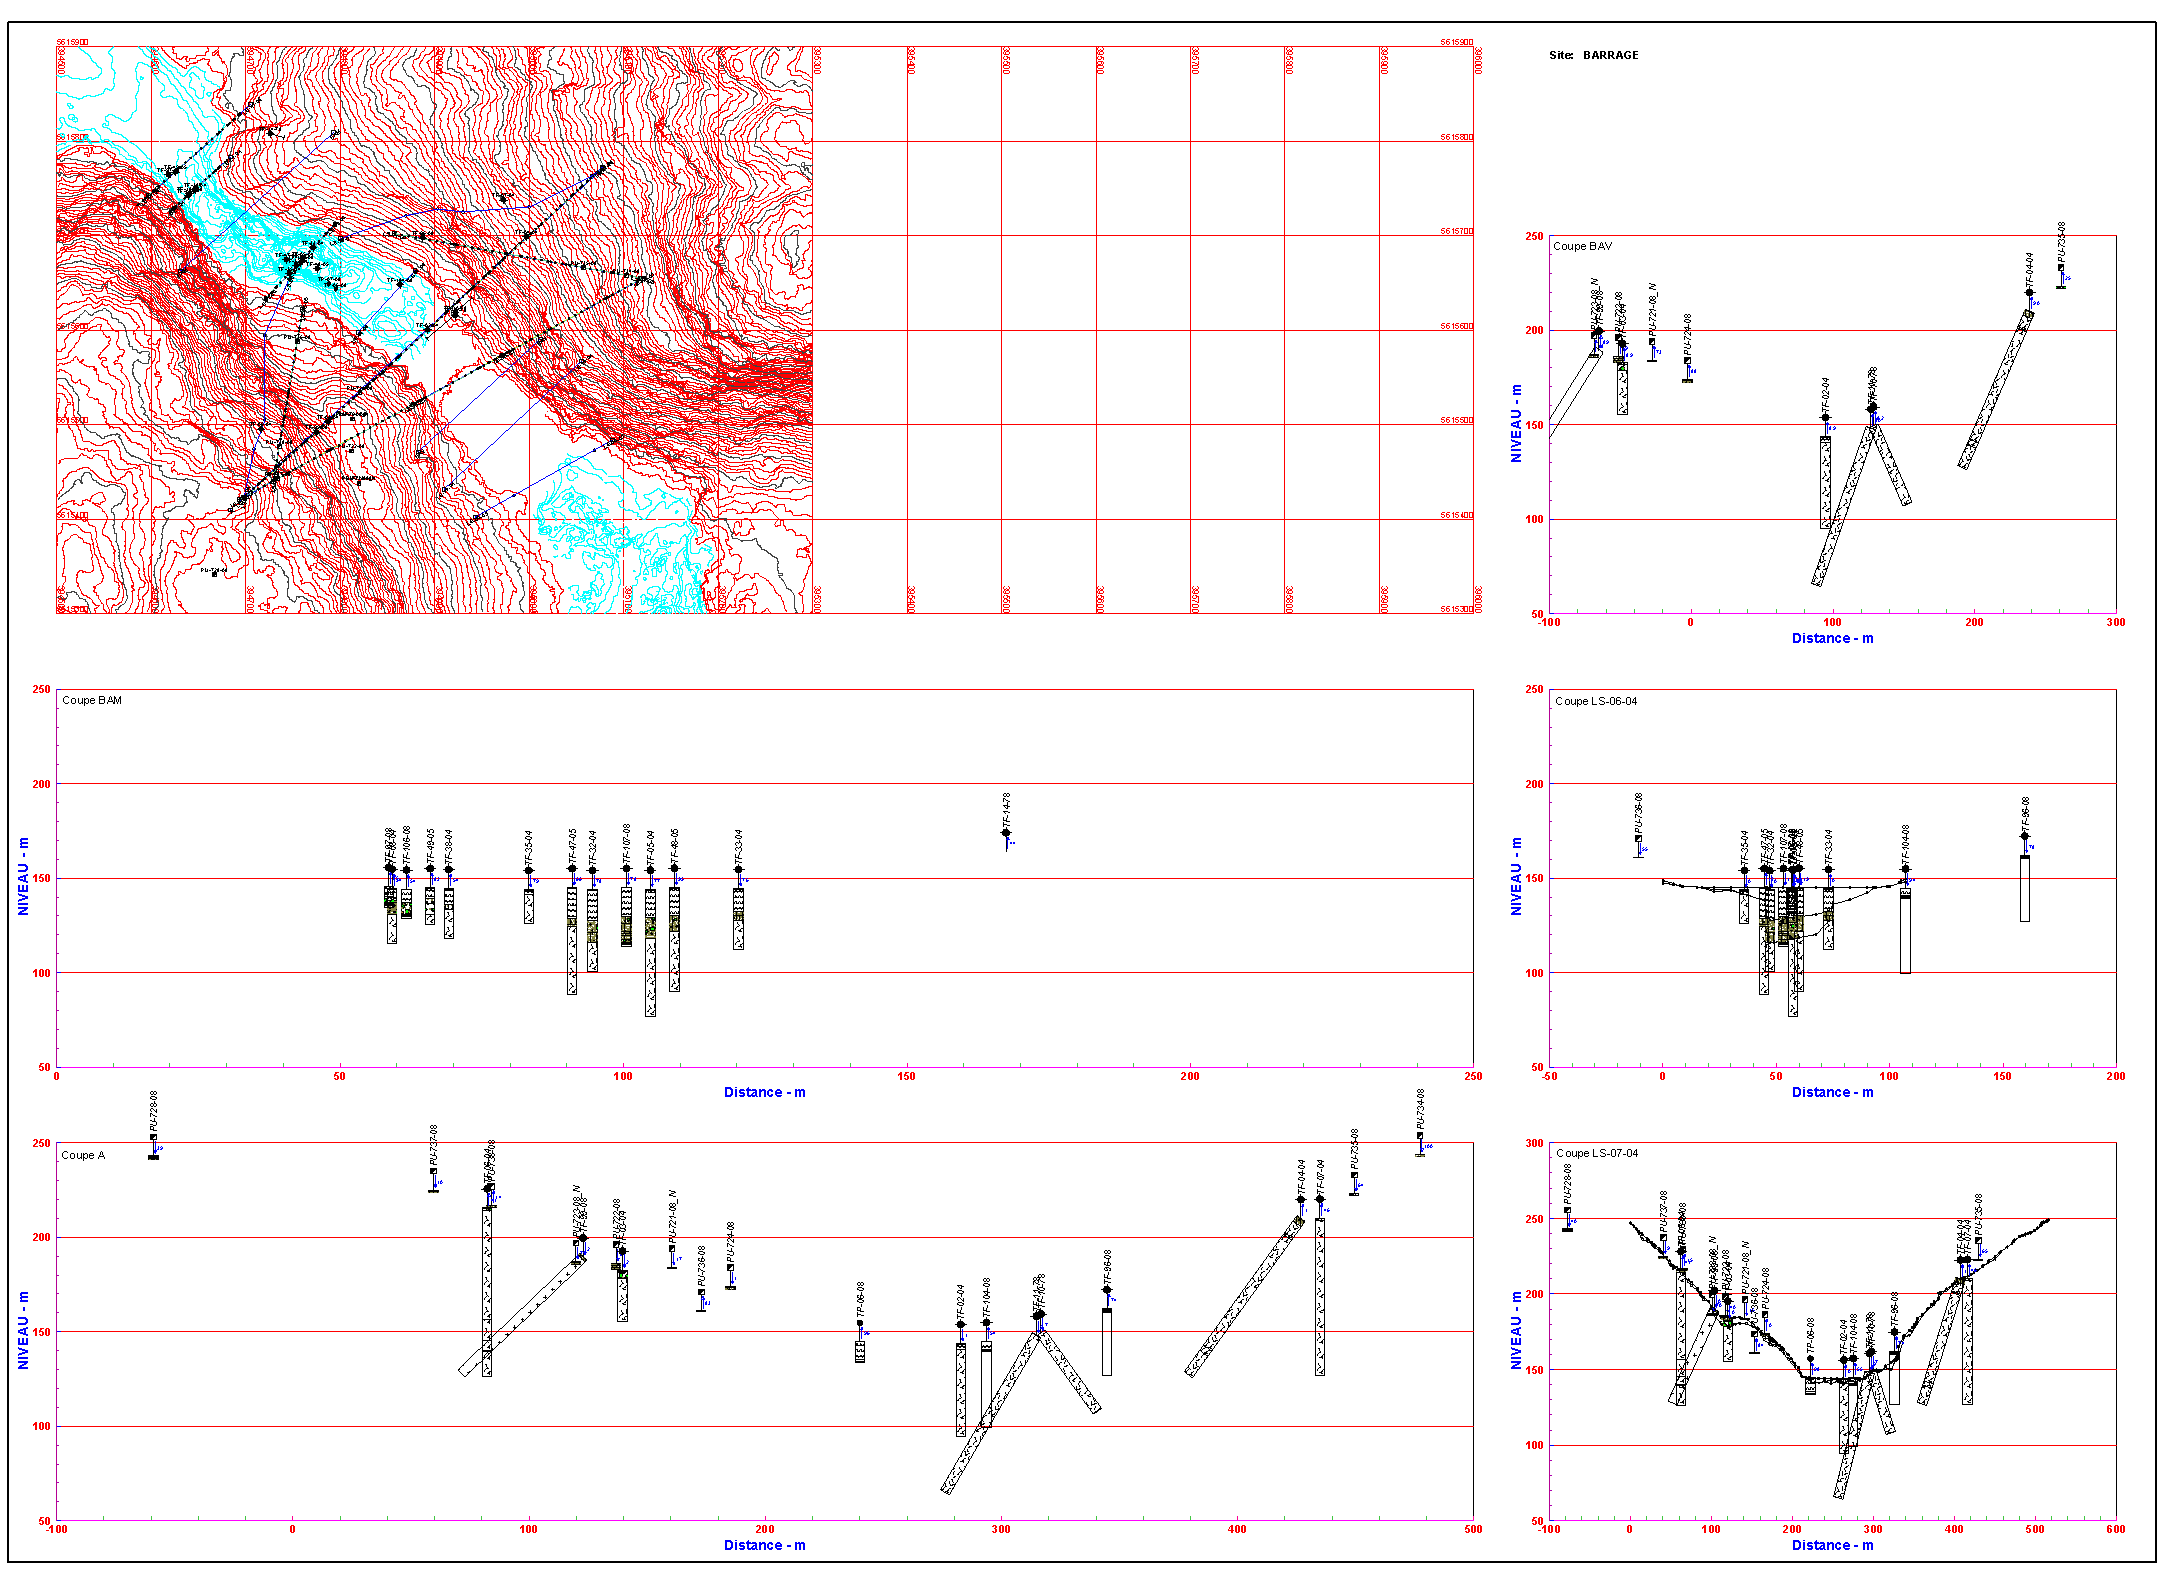
Pro is used to produce profile views of borehole data. With Pro, you can create cross-sections to view geotechnical, environmental or geomechanics properties of boreholes projected on a georeferenced outline.
- Display a location plan view of the borings and outlines
- Display one or several profiles in the same report
- Represent various properties of borings
- Overlay seismic profiles with geophone position and measured velocities
- Overlay data terrain models (DTM or GRD files)
- Re-use the graphic presentations, independent from data, for any project
- Export to DXF for AutoCAD with each boring as a block and grouping of all blocks
Customize your reports
Pro allows customizing of the graphic outputs as needed.
- Selection of borings to project based on distance to outline
- Display of the offset to outline
- Exclusion of certain borings from the profile
- Presentation on various formats (Letter, Legal, 11×17, A0, etc.)
- Customizable X and Y scales for the profiles
- Customizing of columns to present (database field, column width, horizontal scale, type of data display)
- Possibility to display equidistant borings
Data and calculations
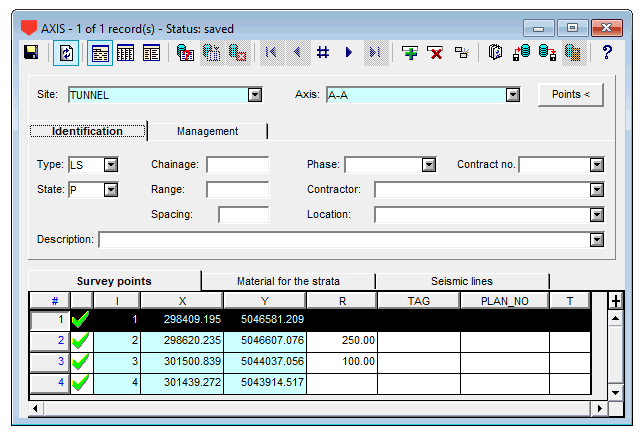
Geotec has entry forms integrated in all modules to enter, modify, consult and delete data. A multitude of calculations are included to obtain results from original measurements.
Pro calculates the projection of borings based on their dip and azimuth. The projection of borings takes into account the radius of curvature defined at intermediary points of the outline.
- Use Google Maps integrated in Geotec to define outlines
- Enter seismic profiles with chainage, elevation and measured velocity
- Import data from CSV files
- Save data automatically in corporate database
