![]()
Geotechnical Instrumentation and Monitoring
Visualize and analyze your data
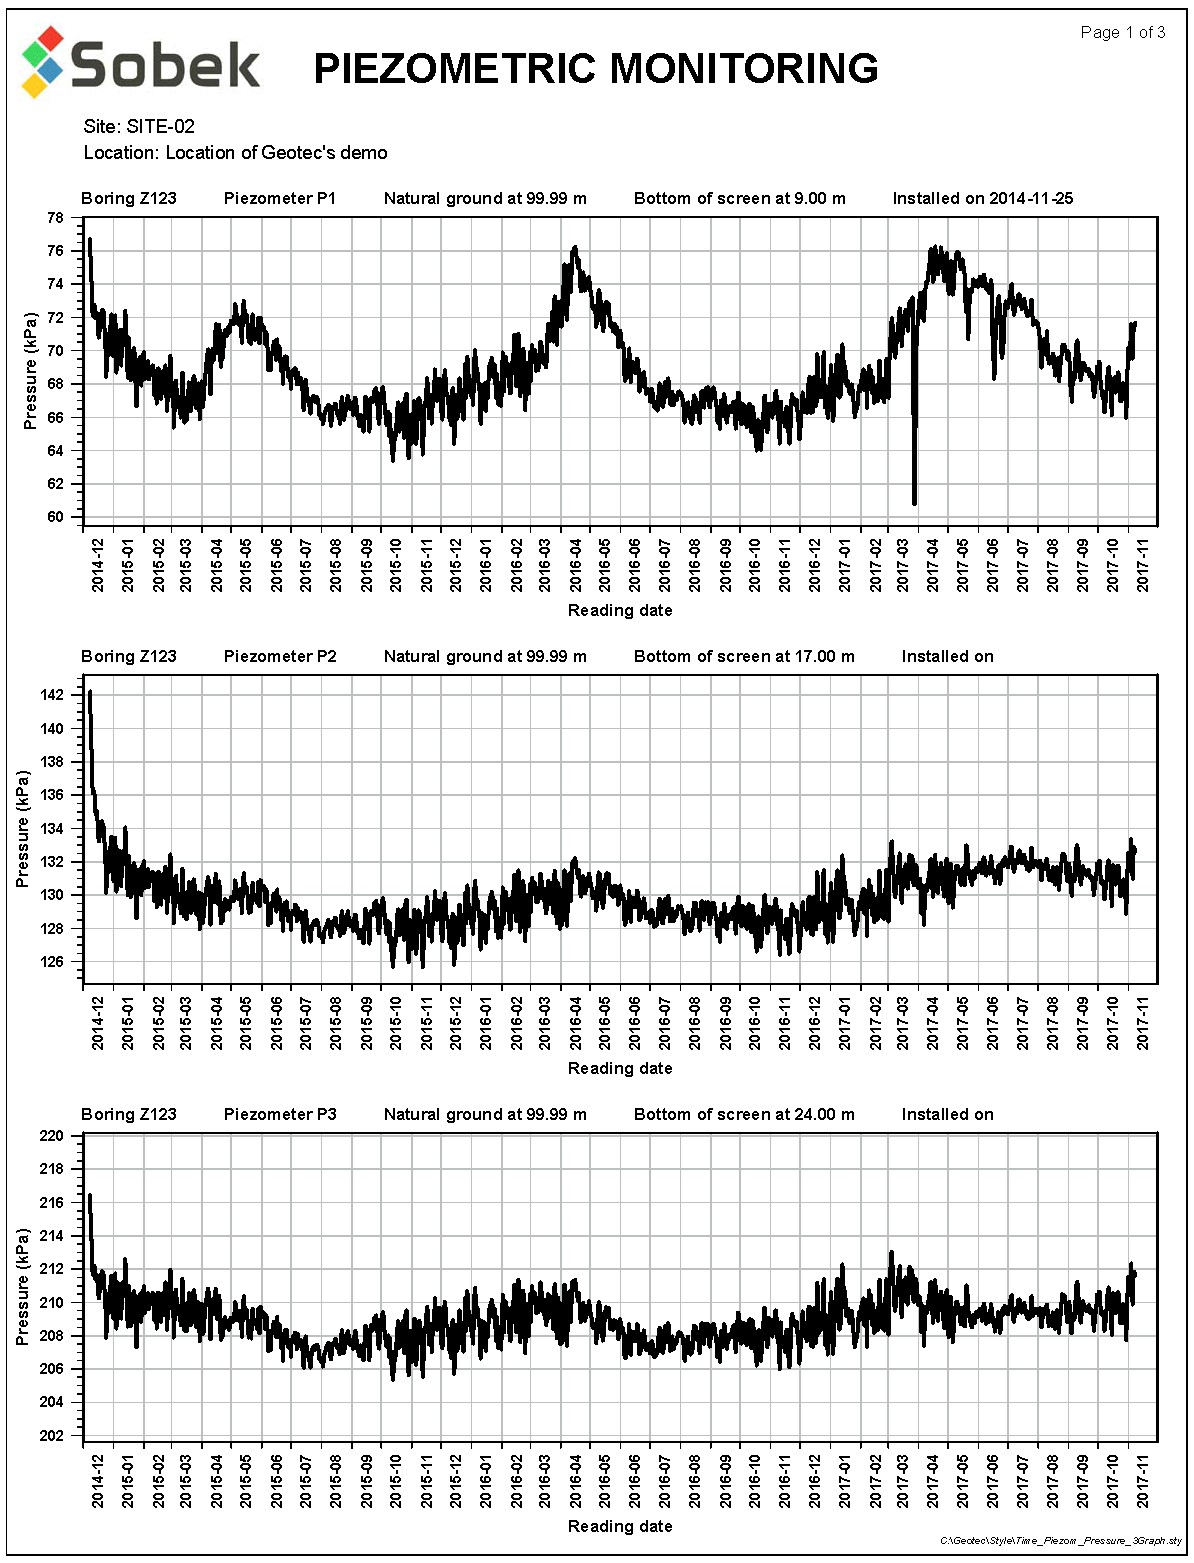
Time is used to monitor piezometry data as a function of time. You can display piezometric data with different graphic representations in order to optimize analysis.
- Display piezometric levels or water pressures as a function of time
- View superimposed data from a nest of piezometers on an unlimited time scale
- View data from one piezometer with superimposed years
- Create reports with multiple graphs per page
- Re-use the graphic presentations, independent from data, for any project

Customize your reports
Time allows customizing of the graphic outputs.
- Indication of bottom depths of screens
- Overlay of natural ground elevation to verify overpressures
- Selection of years to display
- Modification of time limits to focus on critical periods
- Discontinuity between measurements based on a specified time interval

Data and calculations
Geotec has entry forms integrated in all modules to enter, modify, consult and delete data. A multitude of calculations are included to obtain results from original measurements.
A piezometric installation can be displayed schematically on a borehole report in Log, on a cross-section with the most recent water level in Pro, or graphically as a function of time with variations of water level or water pressure in Time.
- Describe well installations, materials and water measurements in the entry forms
- Calculate piezometric levels and water pressures from readings for hydraulic, pneumatic, vibrating chord piezometers and data loggers
- Correct data for atmospheric pressures
- Import data from CSV files
- Save data automatically in corporate database
