![]()
Borehole reports
Visualize and analyze your data
Log is used to produce graphic borehole reports for environmental, geotechnical, rock mechanics or mining projects. With Log, you can display any property measured in a boring at a certain depth.
- Display data in columns as text, histogram, step, polyline, point, color
- Link each column to a table and field of the database
- Customize each column: its title, dimensions, horizontal scale (if applicable)
- Display a vertical scale in meters and / or feet and an elevation scale
- Edit the header and / or footer with relevant information from the database
- Add additional information on each first page of a borehole report
- Overlay information from multiple boreholes
- Re-use the graphic presentations, independent from data, for any project

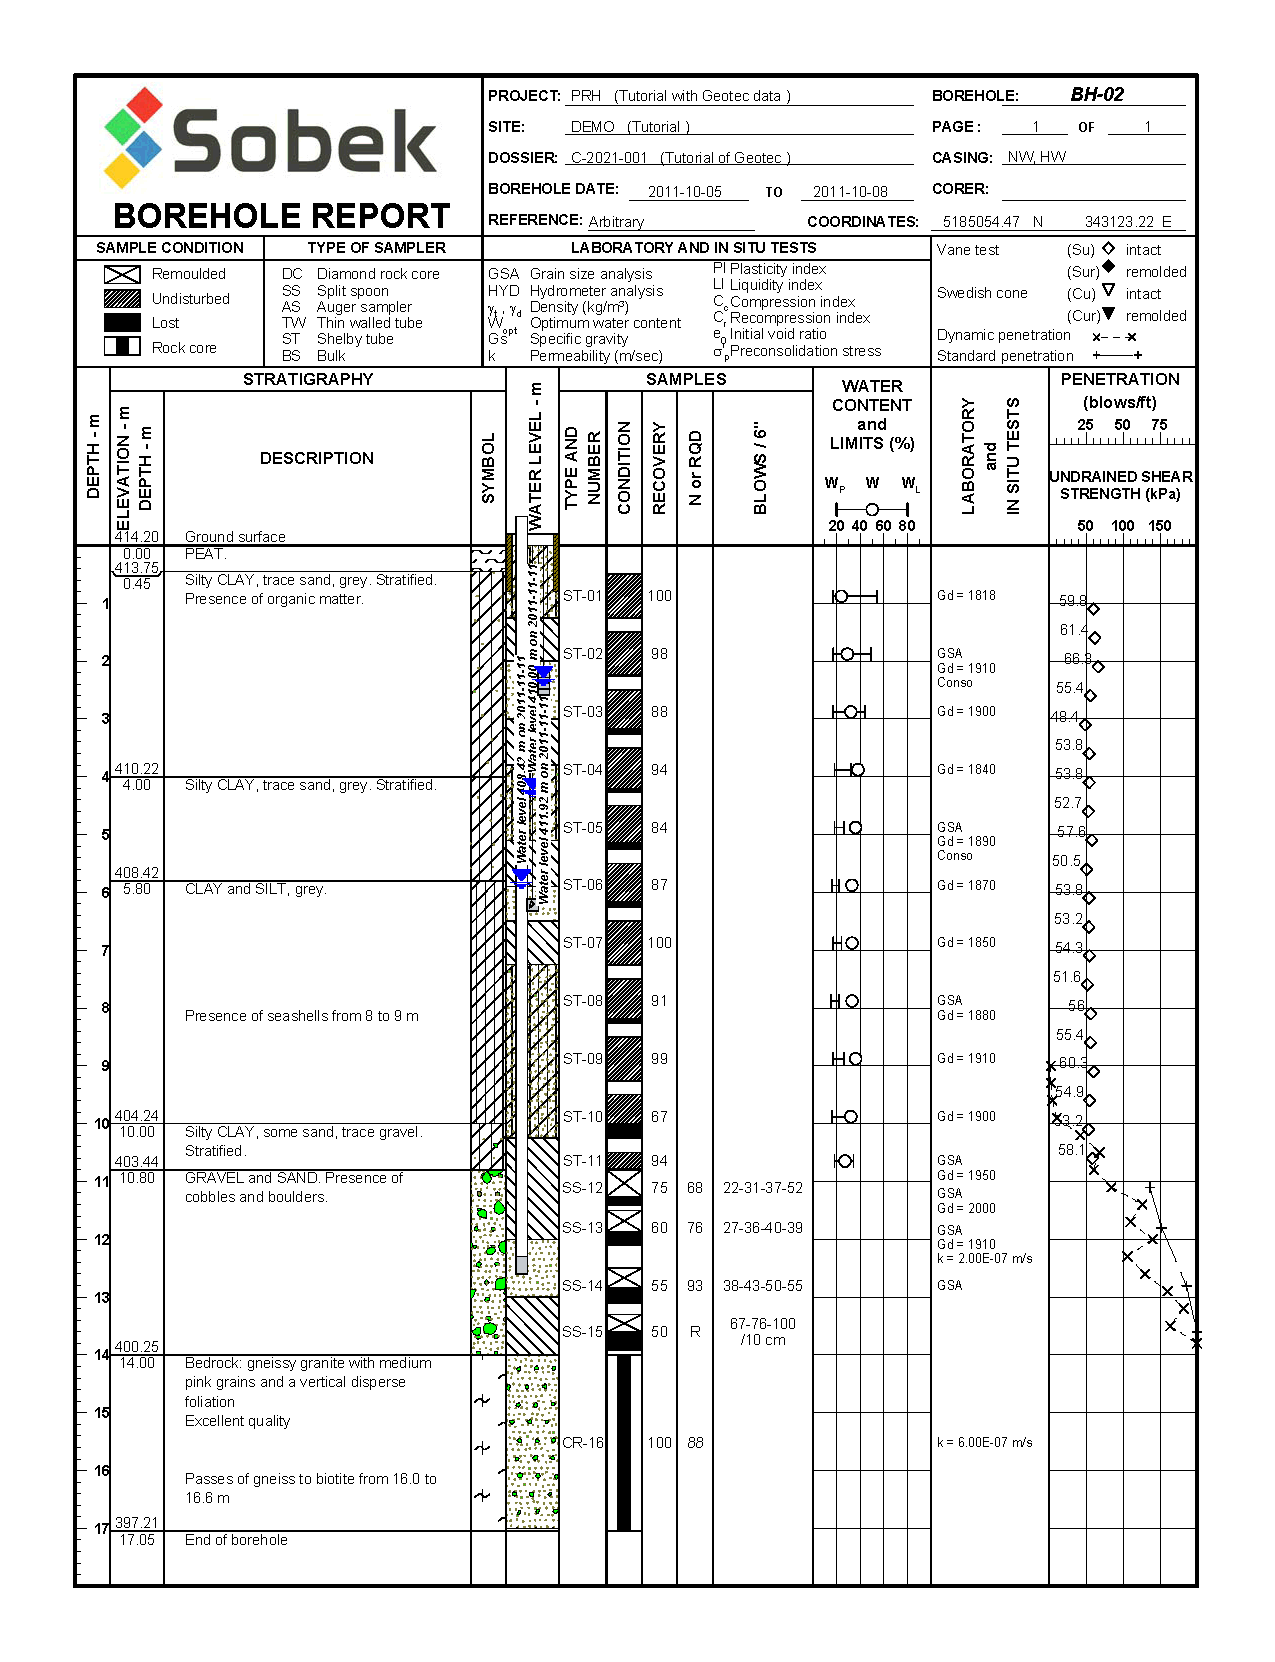
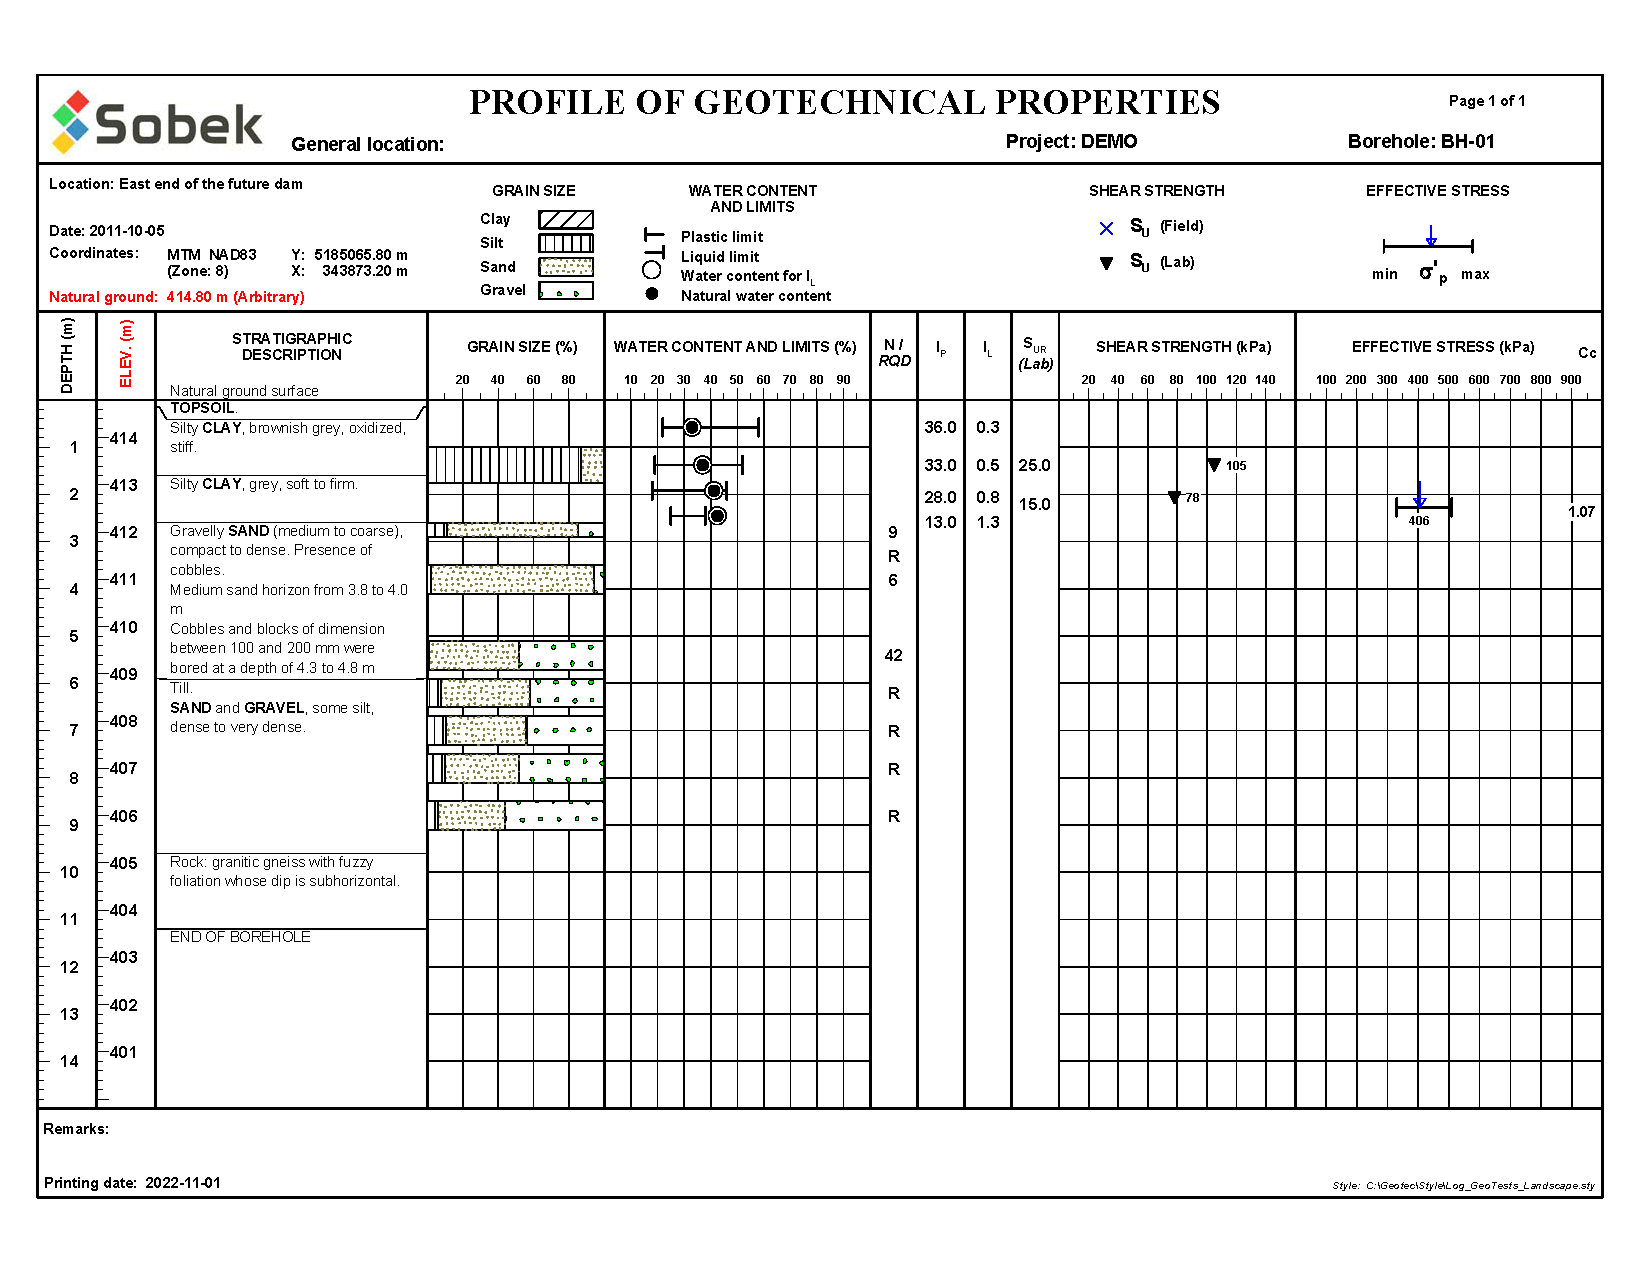
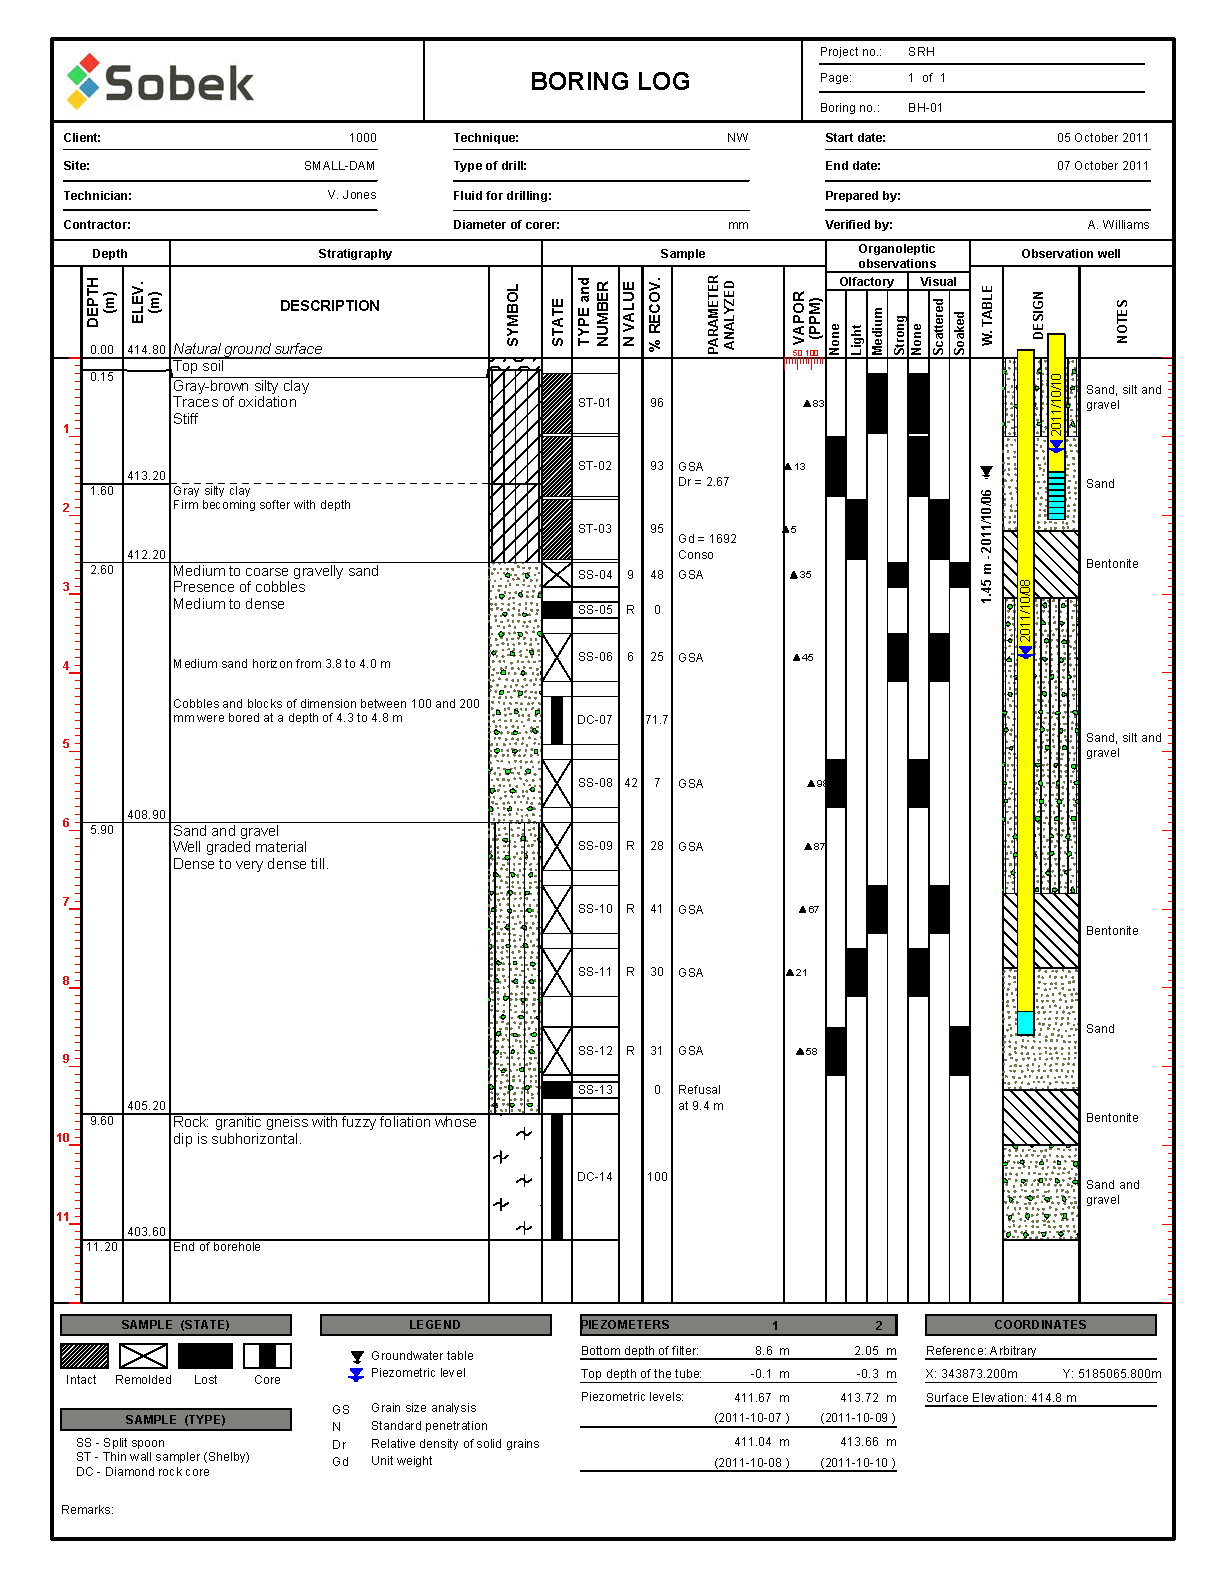
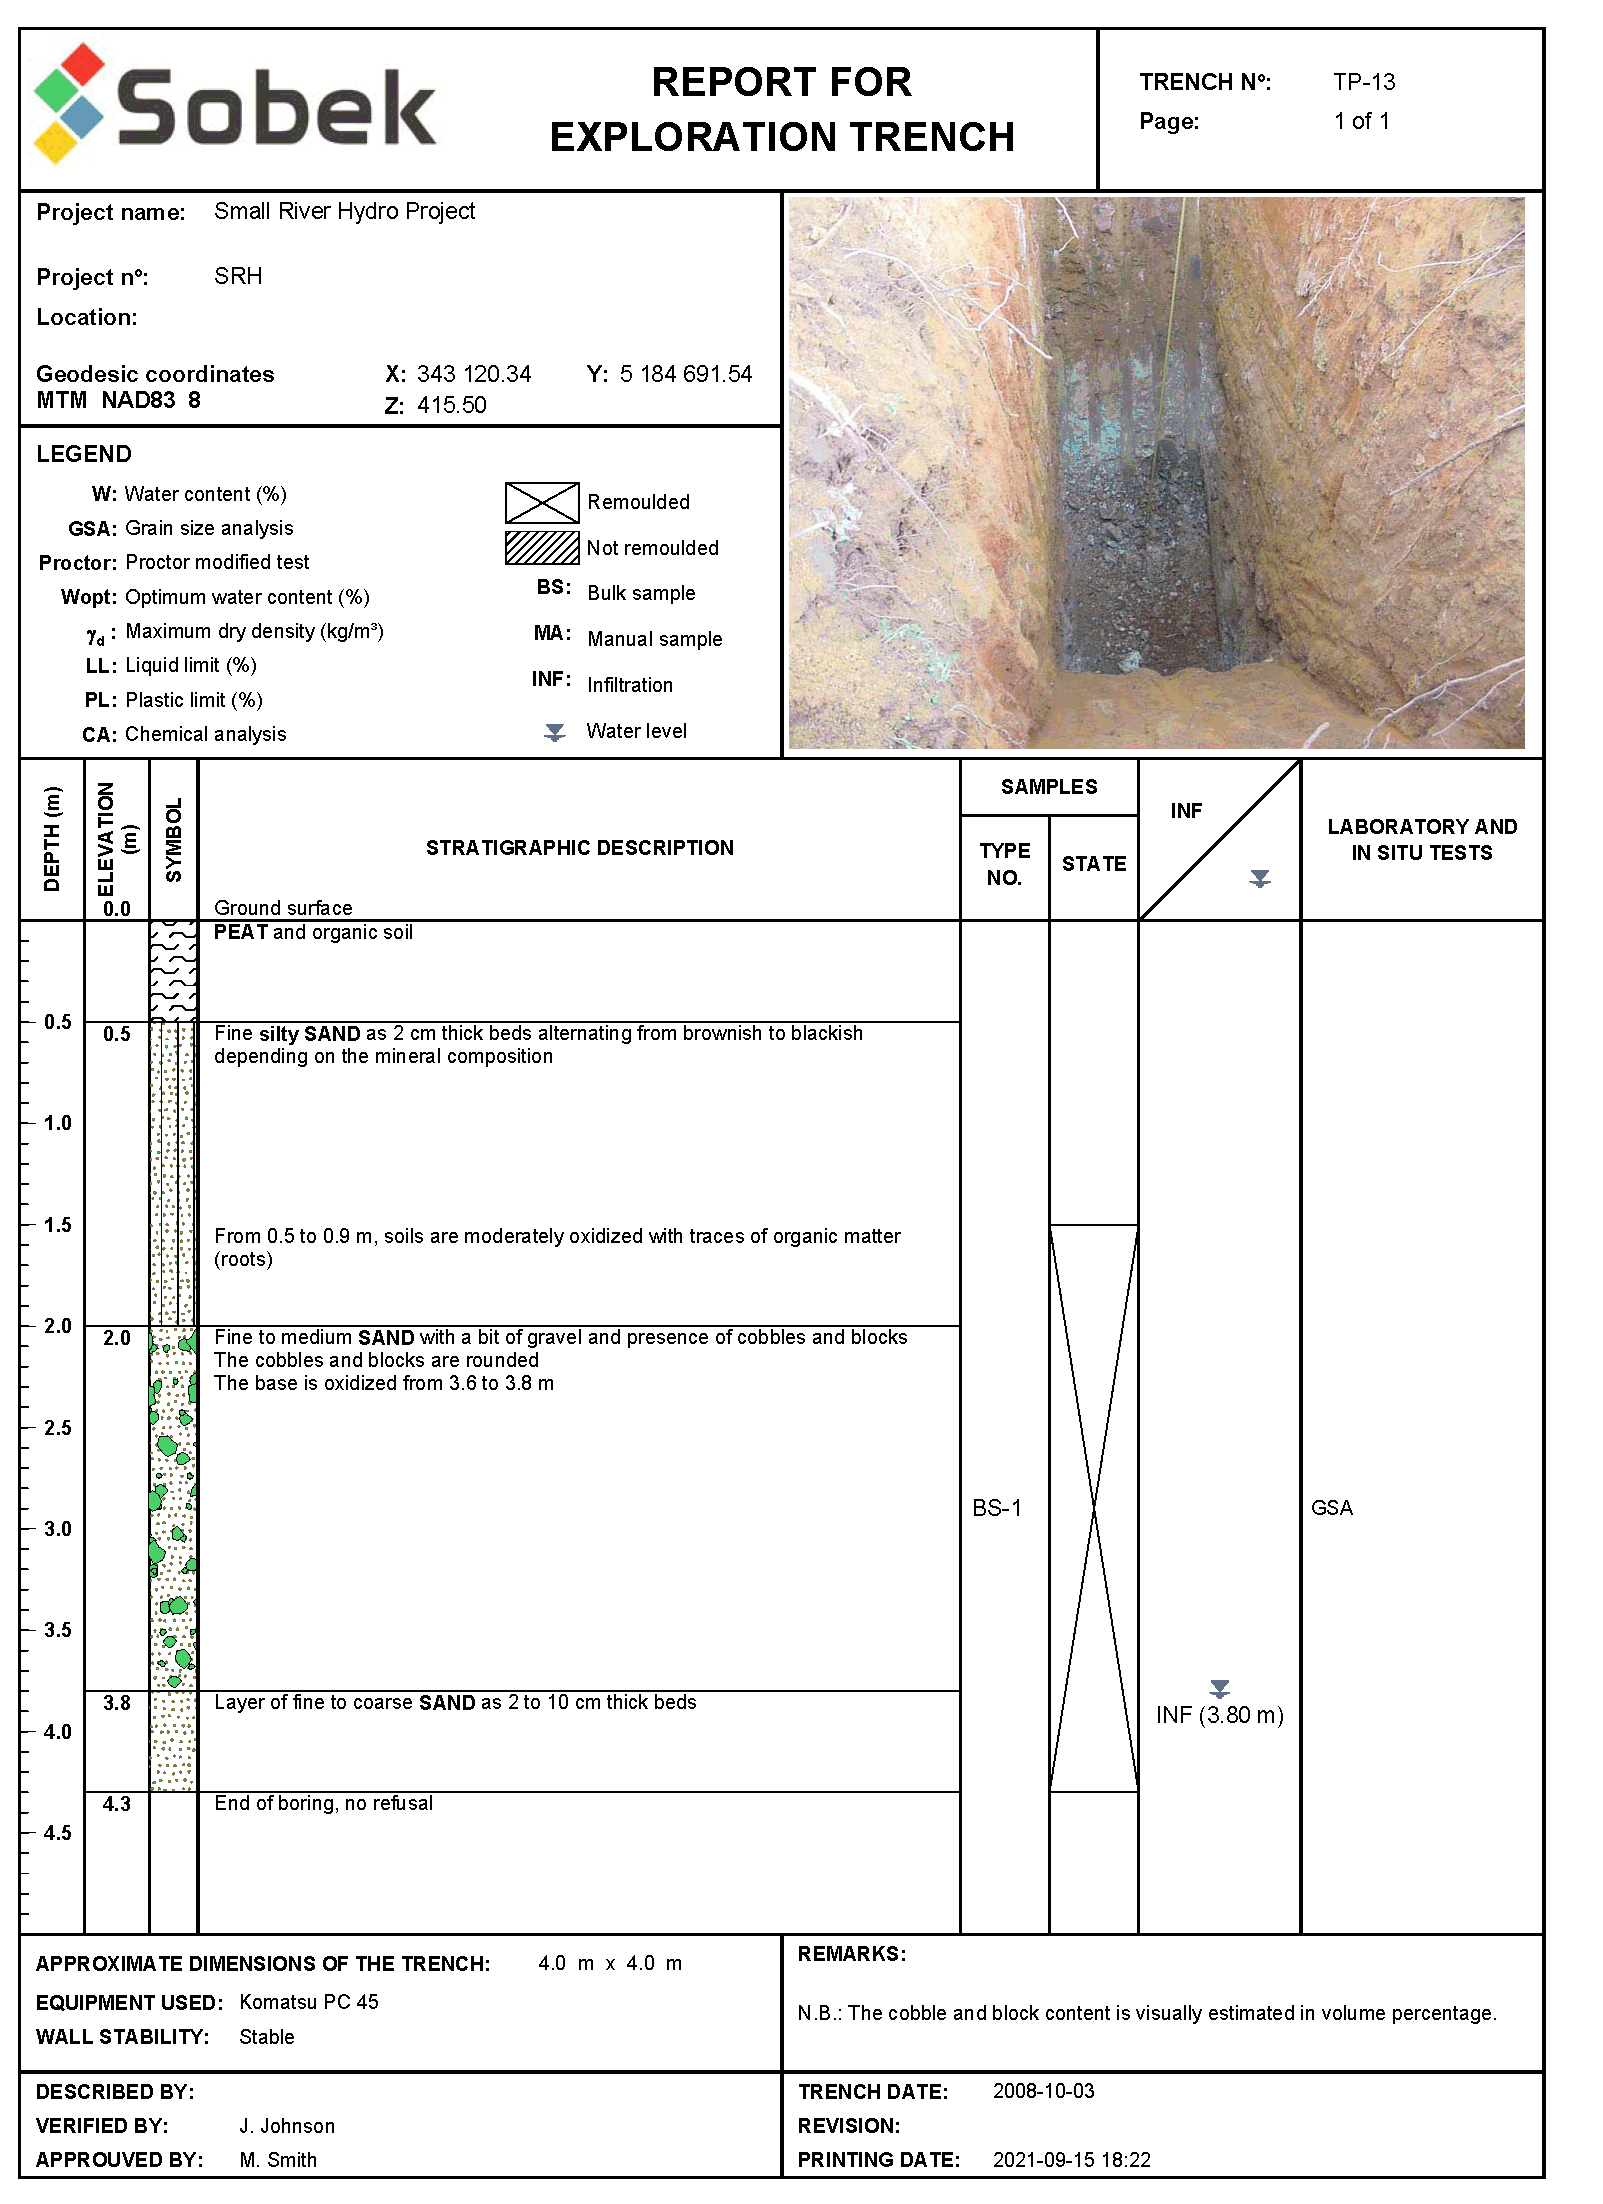
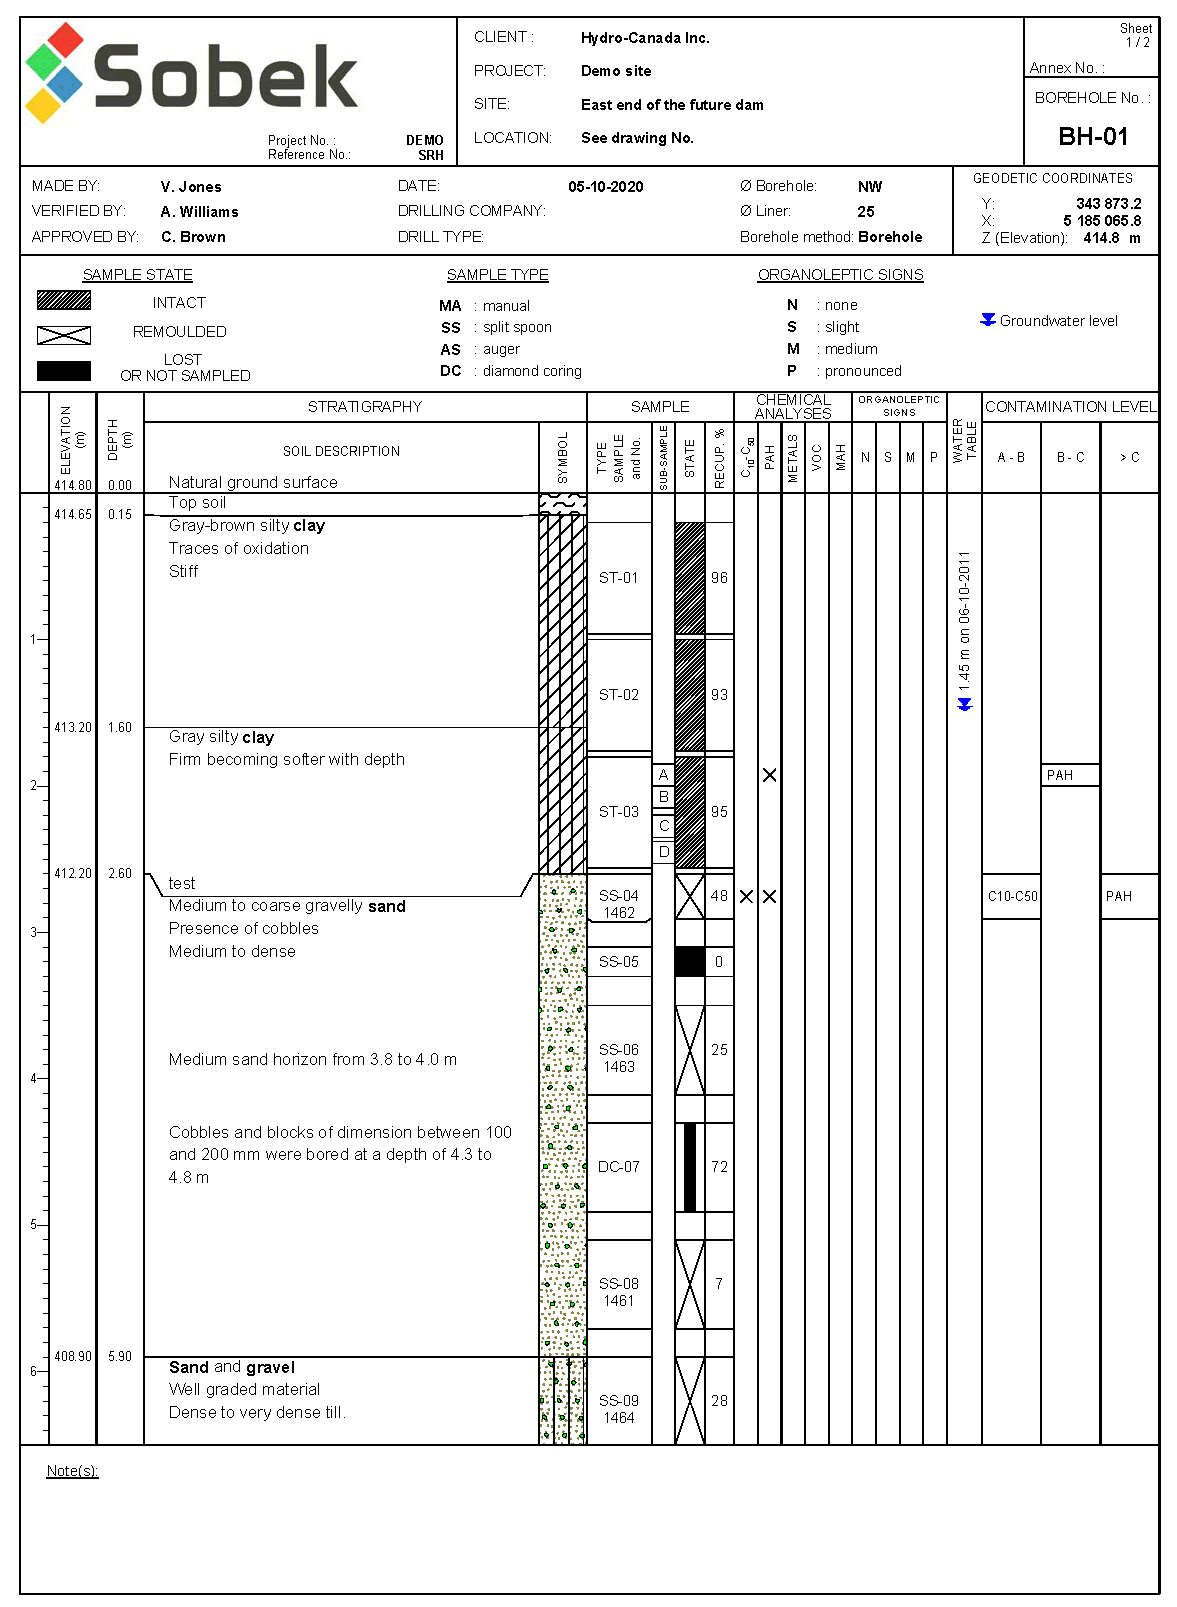
Features for environment and geotechnics
Log is used to produce boring reports for both environmental and geotechnical projects. Visual features include:
- Automatic symbols for samples and stratigraphic layers
- Symbols for sample state
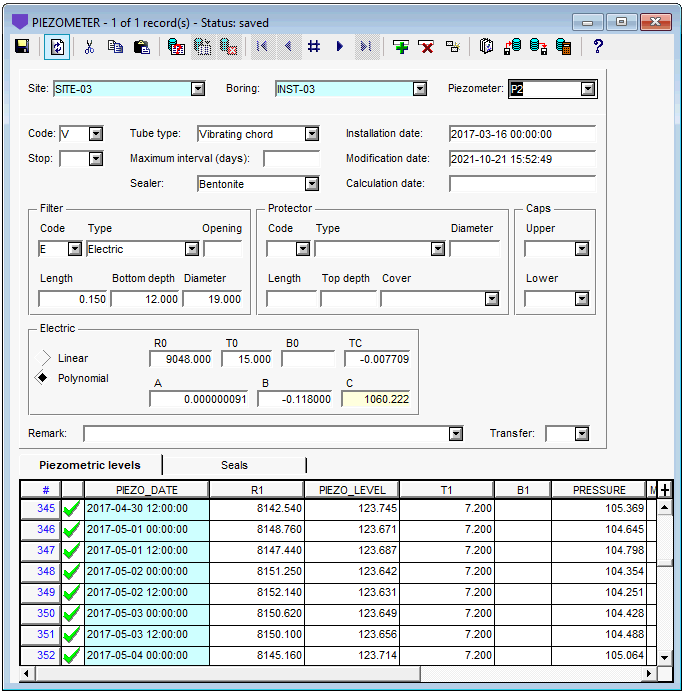
- Representation of piezometer, observation and pumping well installation
- Photos of trench or borehole
- Highlight in all caps, bold or italic the soil category, primary and secondary materials
- Superimposed results from multiple in-situ tests and lab tests with same X-axis
- Organoleptic observations
- Chemical analyses and contamination levels

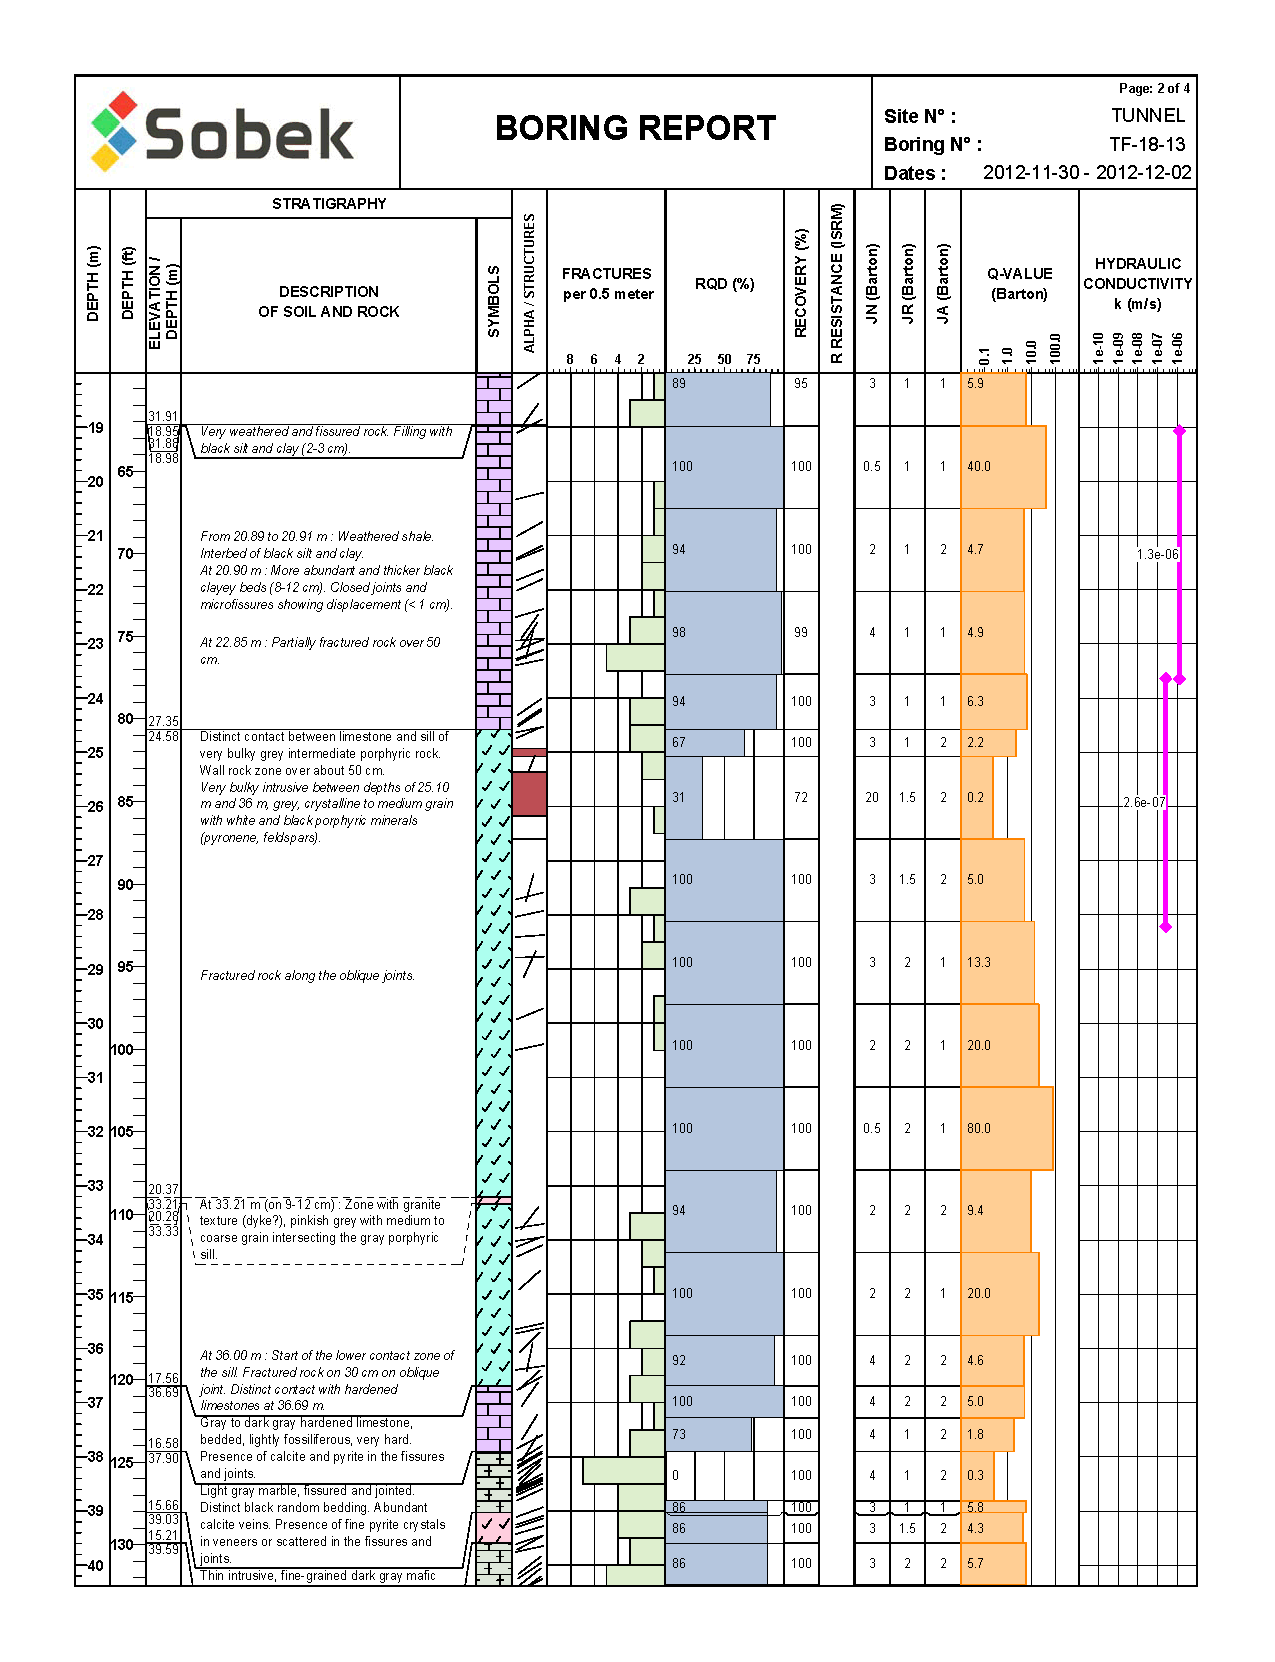
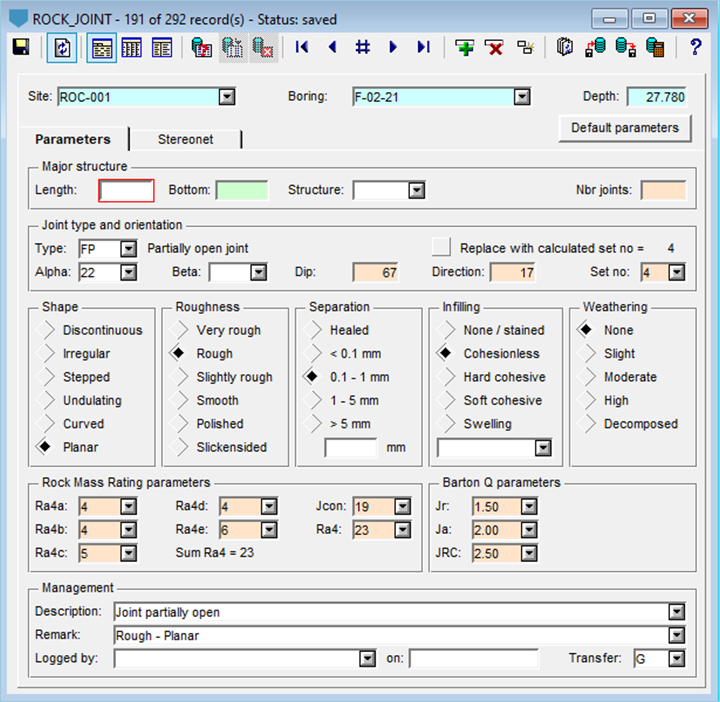
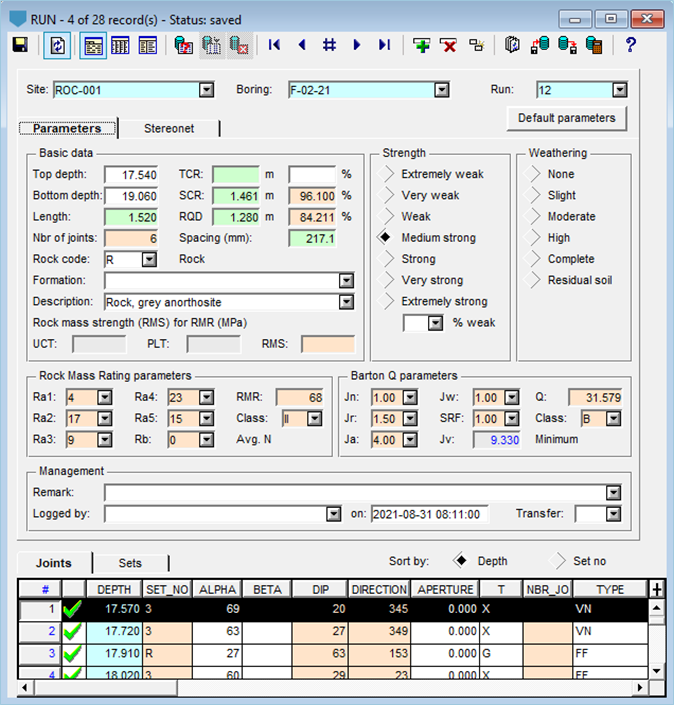
Features for rock mechanics
Log is used to produce boring reports for rock mechanics projects. Visual features include:
- Rock joints with symbols oriented with alpha and beta or dip and direction
- Major structures highlighted with color
- 3D, optical and acoustic images from geocamera
- Number of joints or joint spacing per meter or per fraction of a meter displayed automatically from data
- Colors for range of values such as RQD, RMR or Barton Q
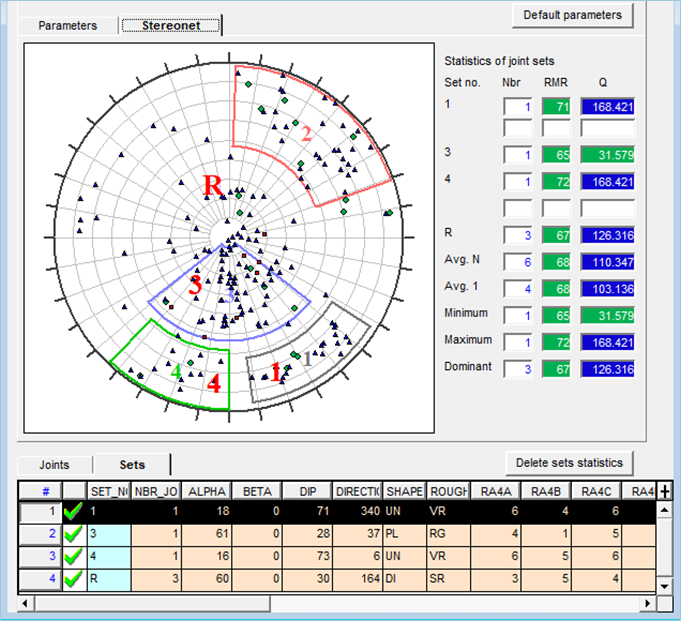
Geotec has entry forms specific to rock mechanics. Features include:
- Calculation of joints ratings based on joint logging
- Estimation of ratings per joint set and per run
- Calculation and display of stereonet
- Calculation of Barton Q, RMR and rock classification
- Point load test and UCT test

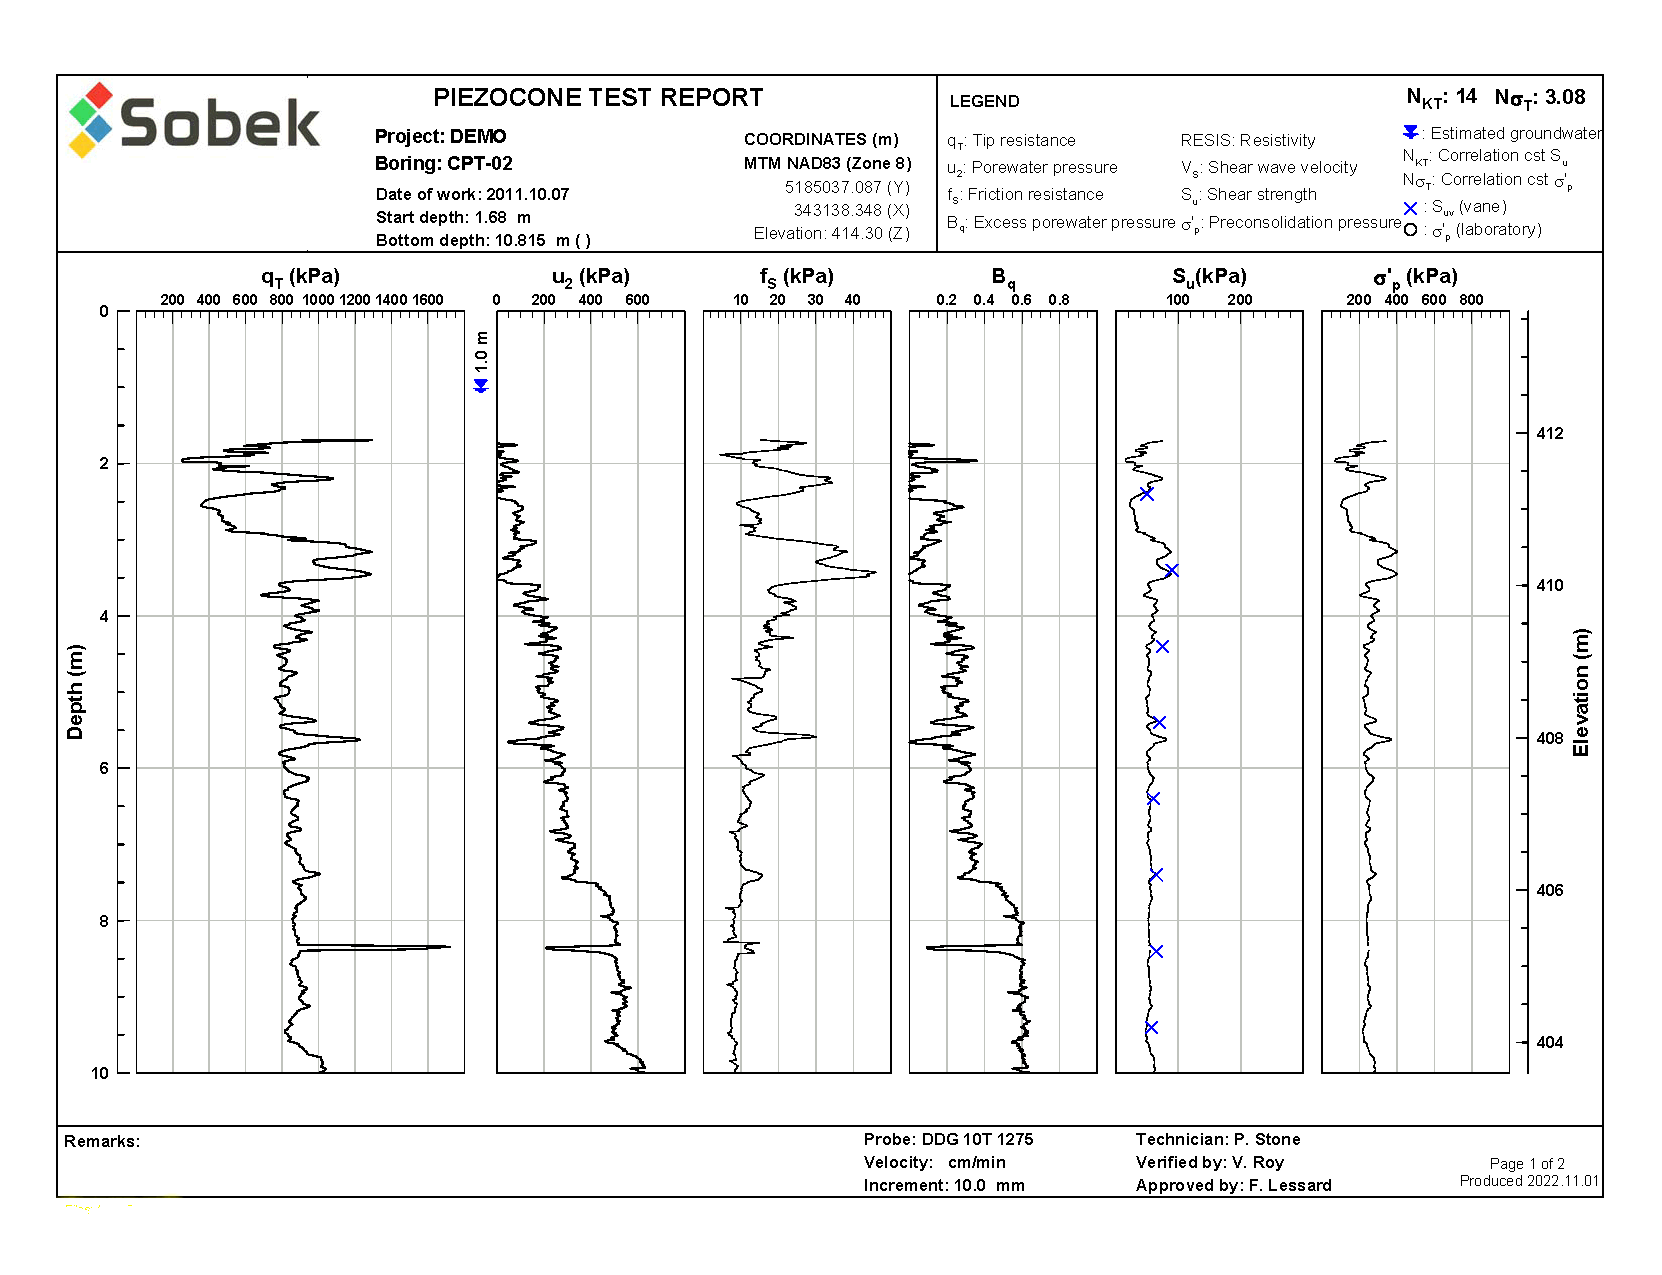
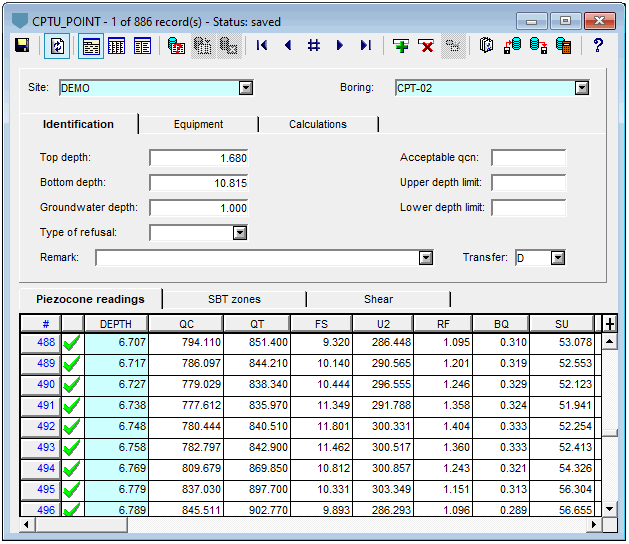
Features for cone penetration testing
Log is used to produce boring reports specific to piezocone penetration testing. Some visual features include:
- Correlation of CPTu test results with properties of a parent boring such as shear strength or preconsolidation pressure
- Overlay of multiple CPTu tests in the same report with distinct attributes
- Display of SBT zones based on minimal thickness
Geotec has entry forms specific to CPTu. Some features include:
- CSV import of input parameters (depth, QT or QC, FS and U2)
- User-defined calculation settings (Nkt, Nst, Ic min…)
- Calculation of CPTu parameters with depth based on inputs (Robertson)
- Calculation of Vs and Vs normalized, and support of shear wave velocities acquired with CPTu
- Support of resistivity / conductivity downhole measurement
- Interpretation of SBT based on 6 methods

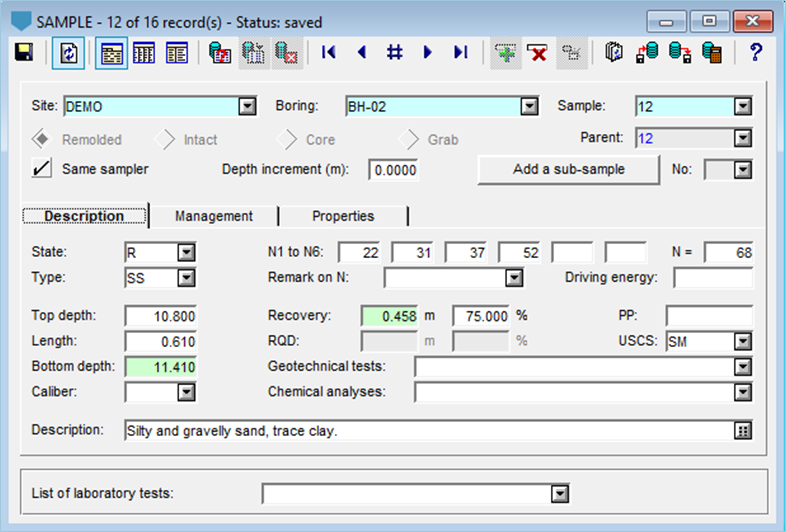
Data and calculations
Geotec has entry forms integrated in all modules to enter, modify, consult and delete data. A multitude of calculations are included to obtain results from original measurements.
- Describe samples and layers with a soil description matrix
- Describe well installations, materials and water measurements
- Calculate all levels automatically from ground elevation and dip
- Add samples and sub-samples with default type, length and depth or from previous sampler with automatic numbering
- Calculate contamination levels from concentrations measured
- Import data from CSV files
- Save data automatically in corporate database
