![]()
Laboratory tests
Visualize and analyze your data
Lab is used to produce graphic reports for laboratory tests done on aggregates, both detailed reports for each test or summary reports for your projects. You can calculate the results of your tests based on the measurements entered.
- Display the test graph in the report
- Display one or multiple curves in the same summary report
- Apply smoothing coefficient to curves, if needed
- Display summary tables showing information linked to the samples
- Display test-specific tables showing laboratory measurements and calculations
- Re-use the graphic presentations, independent from data, for any project
- Import data from CSV files
- Save data automatically in corporate database
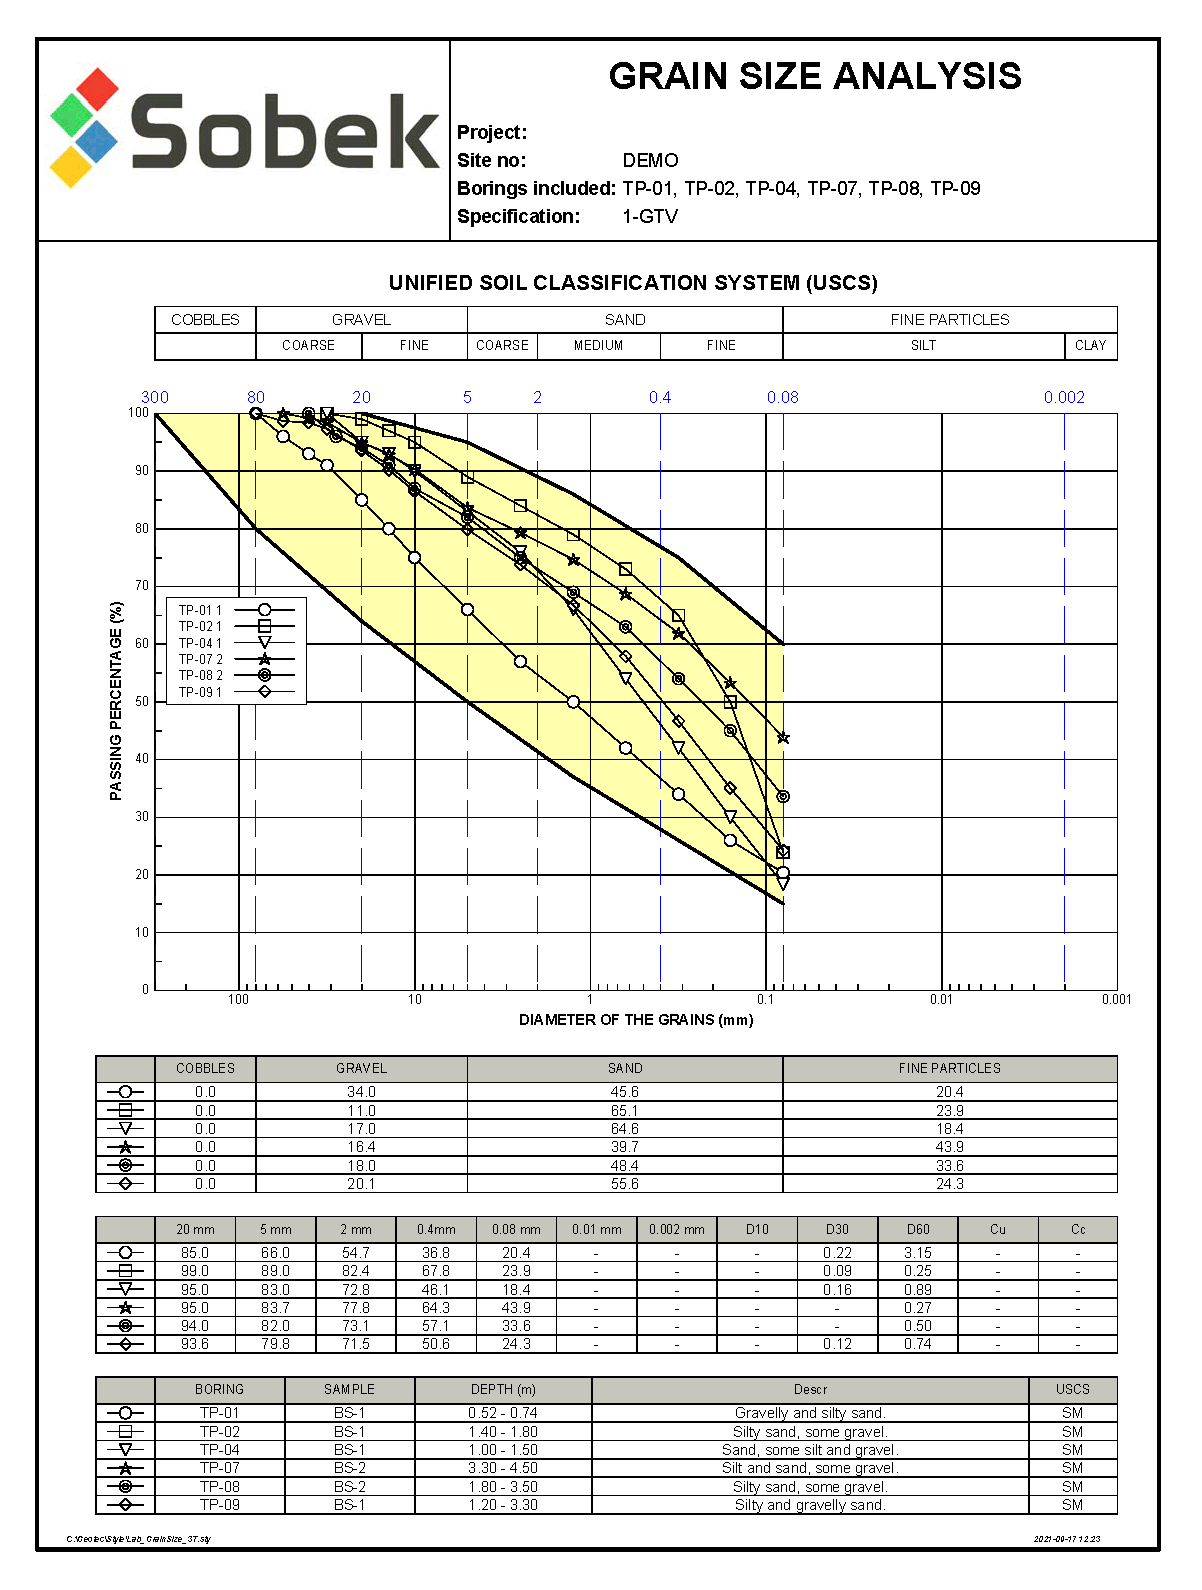
Lab also offers more advanced options for grain size tests.
- Statistics for a series of curves (minimum, maximum, average, etc.)
- Correction to include percentages of cobbles and blocks
- Simulation of separation at a specific diameter
- Combination of grain size curves to determine the resulting curve

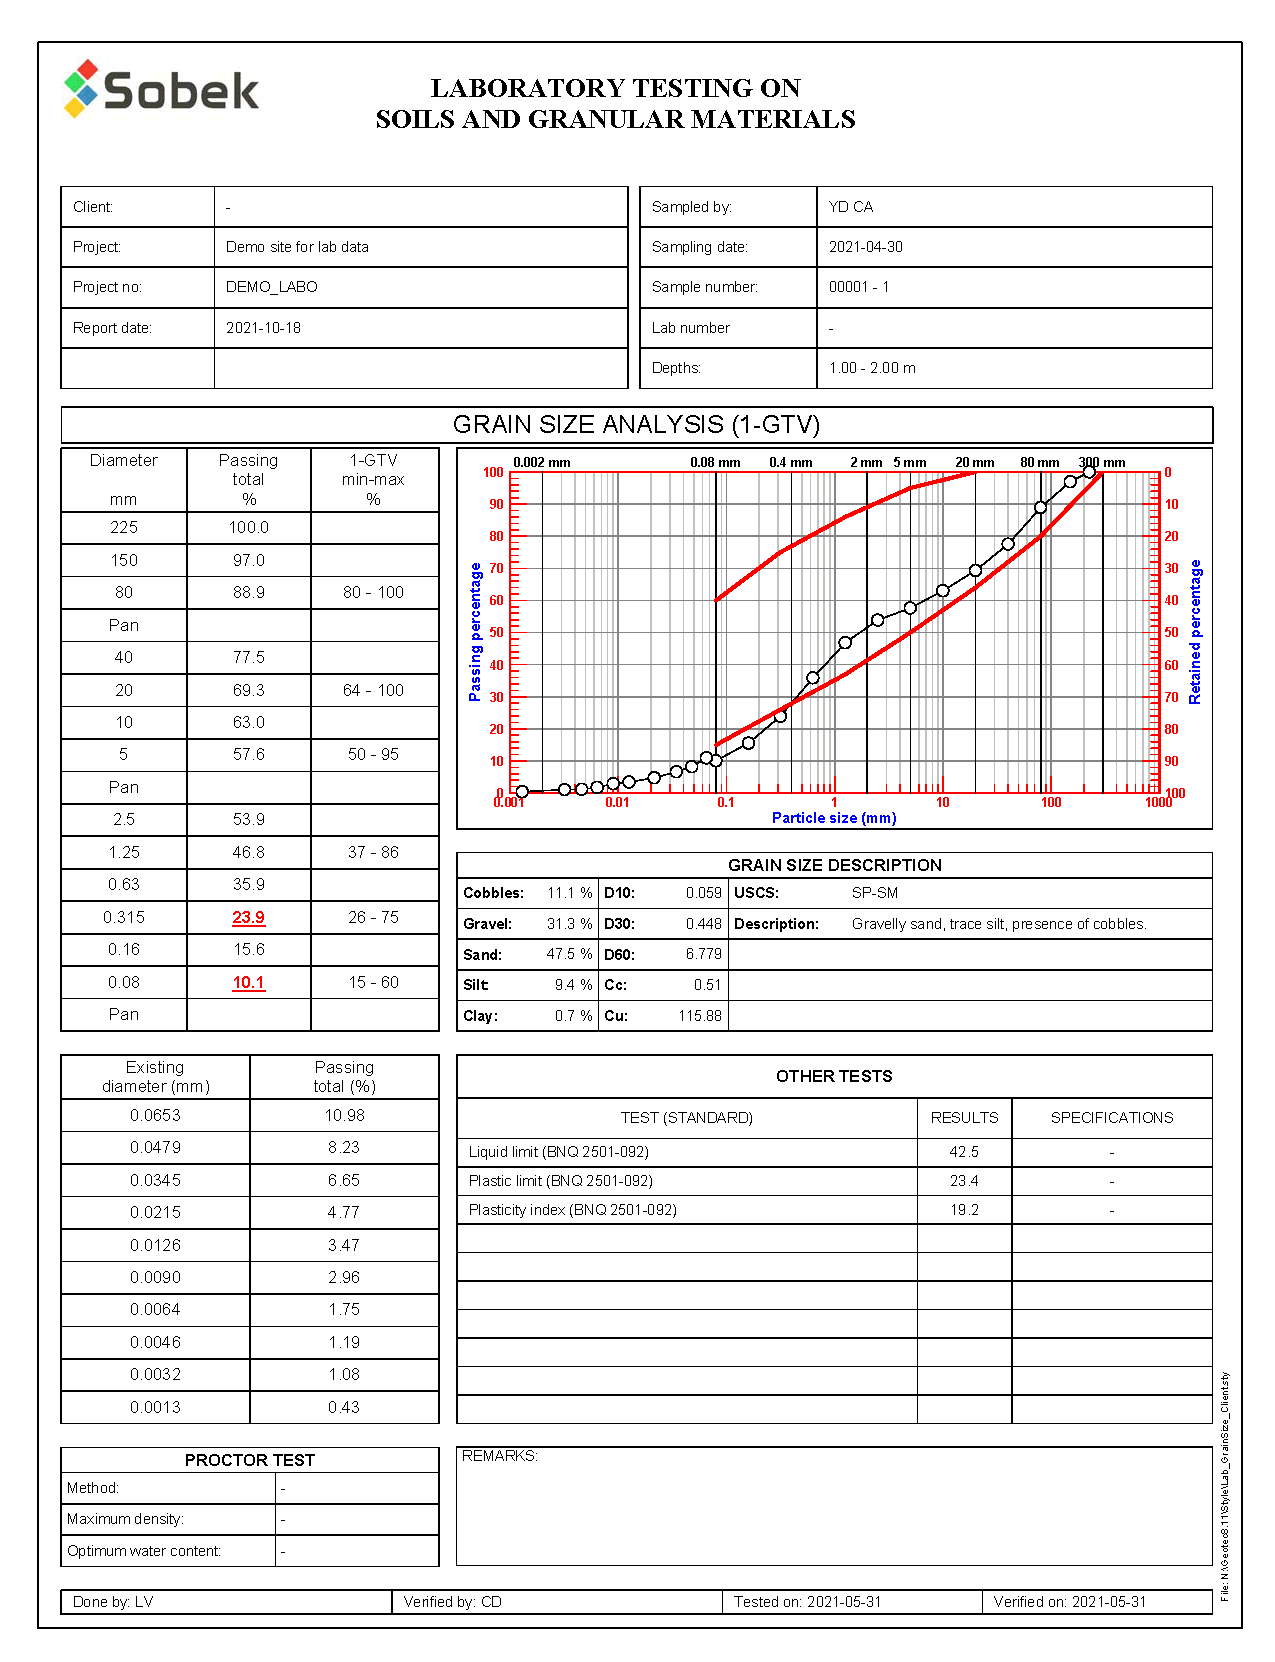
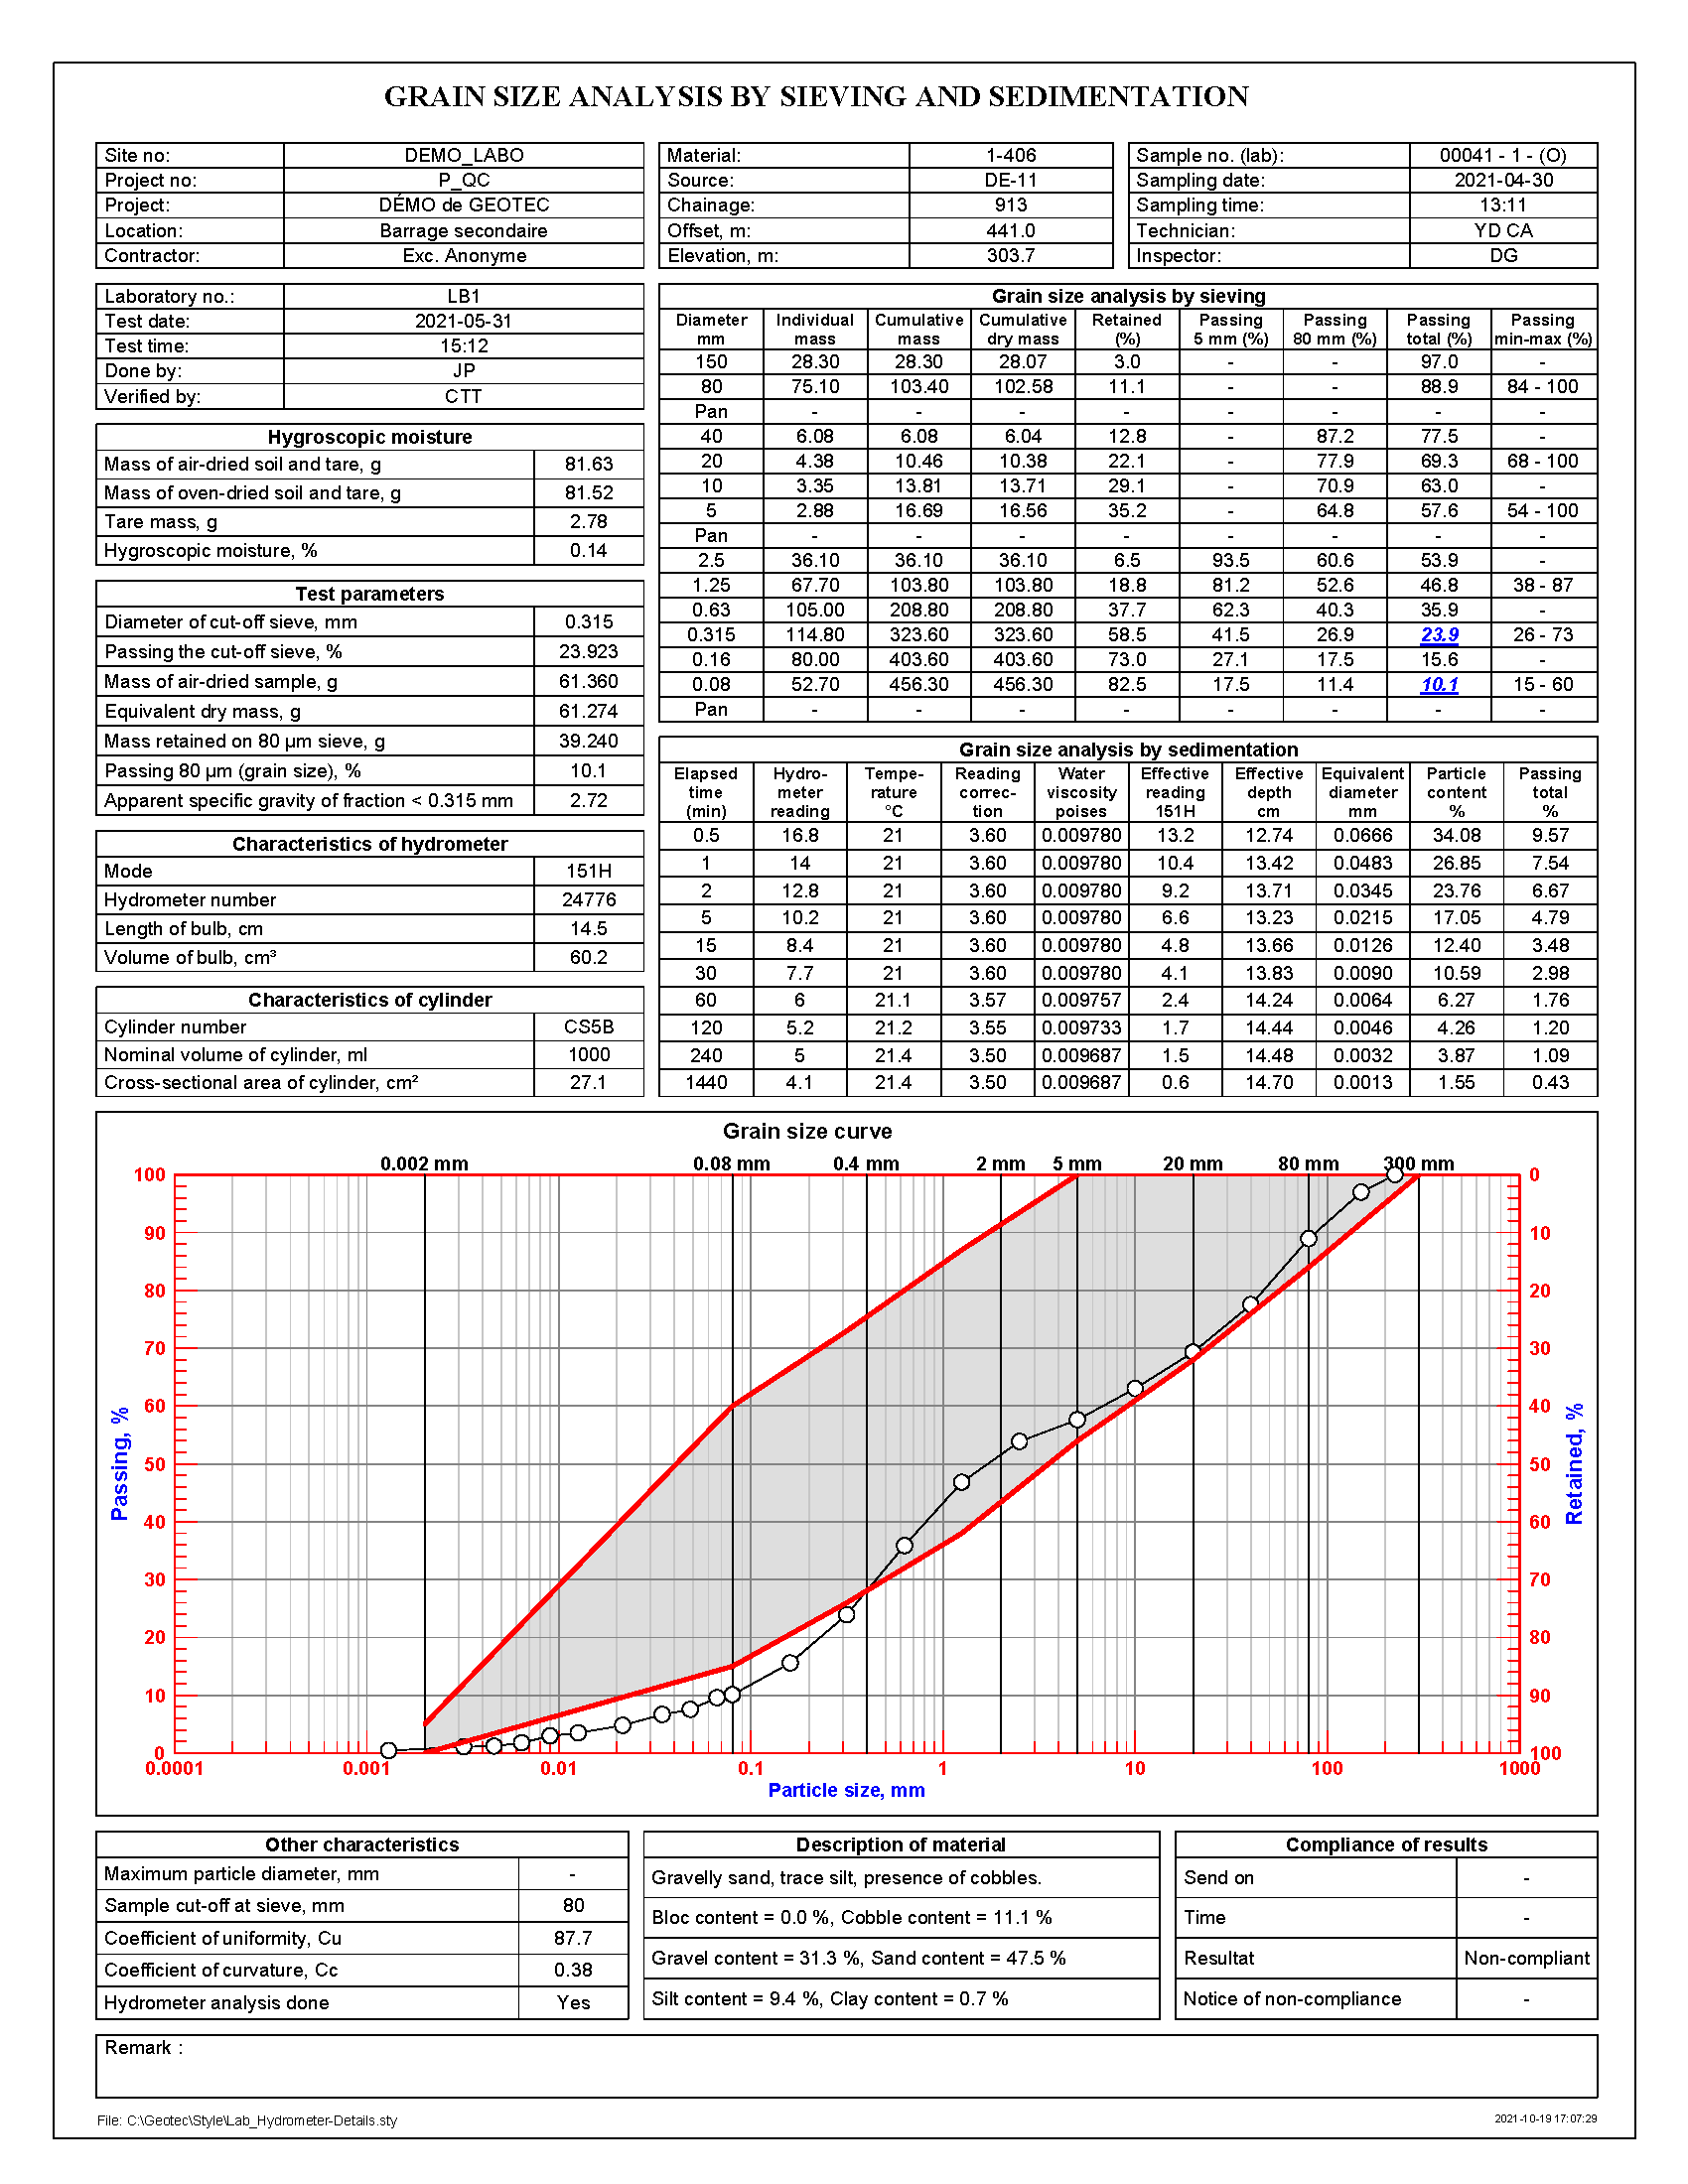
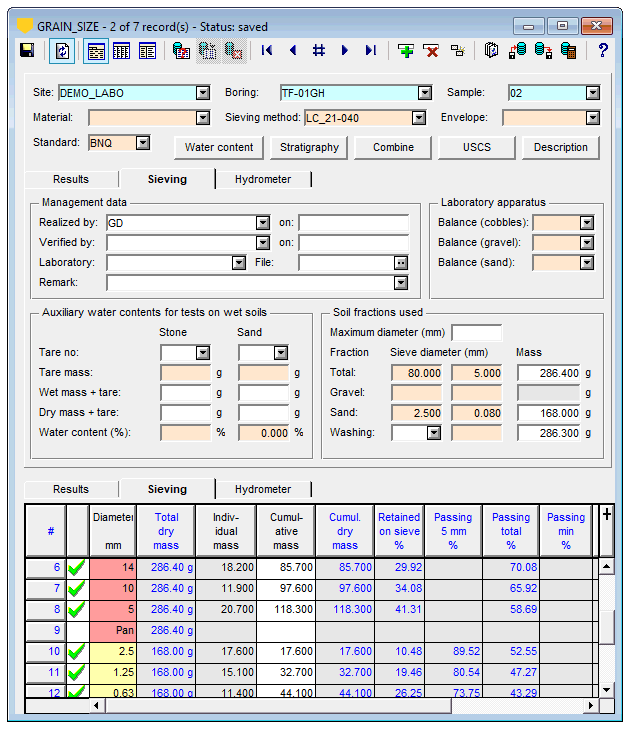
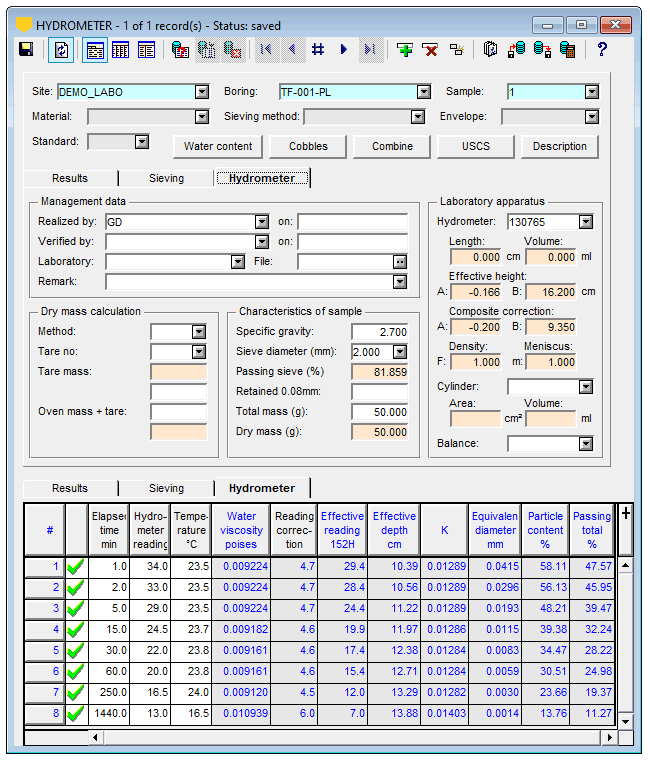
Grain size analysis (sieving and hydrometer)
Geotec is used to calculate the complete grain size curve based on the sieving and hydrometer tests done on the samples. Geotec provides flexibility with regards to the methods used in the laboratory.
In Lab, display the grain size curve with the passing and / or retained percentage as a function of diameter, from blocks to clay. The particle size requirement can also be overlaid.
- Sieving method specified per test, with one, two or three sieve sets
- Entry of individual or cumulative masses
- Conformity of curve with selected grain size requirement
- Calibration of 151H and 152H hydrometers
- Composite correction or reference solution
- Geotec calculates passing percentages, effective diameters, fineness module, Cu and Cc coefficients, materials proportions, USCS classification and grain size description

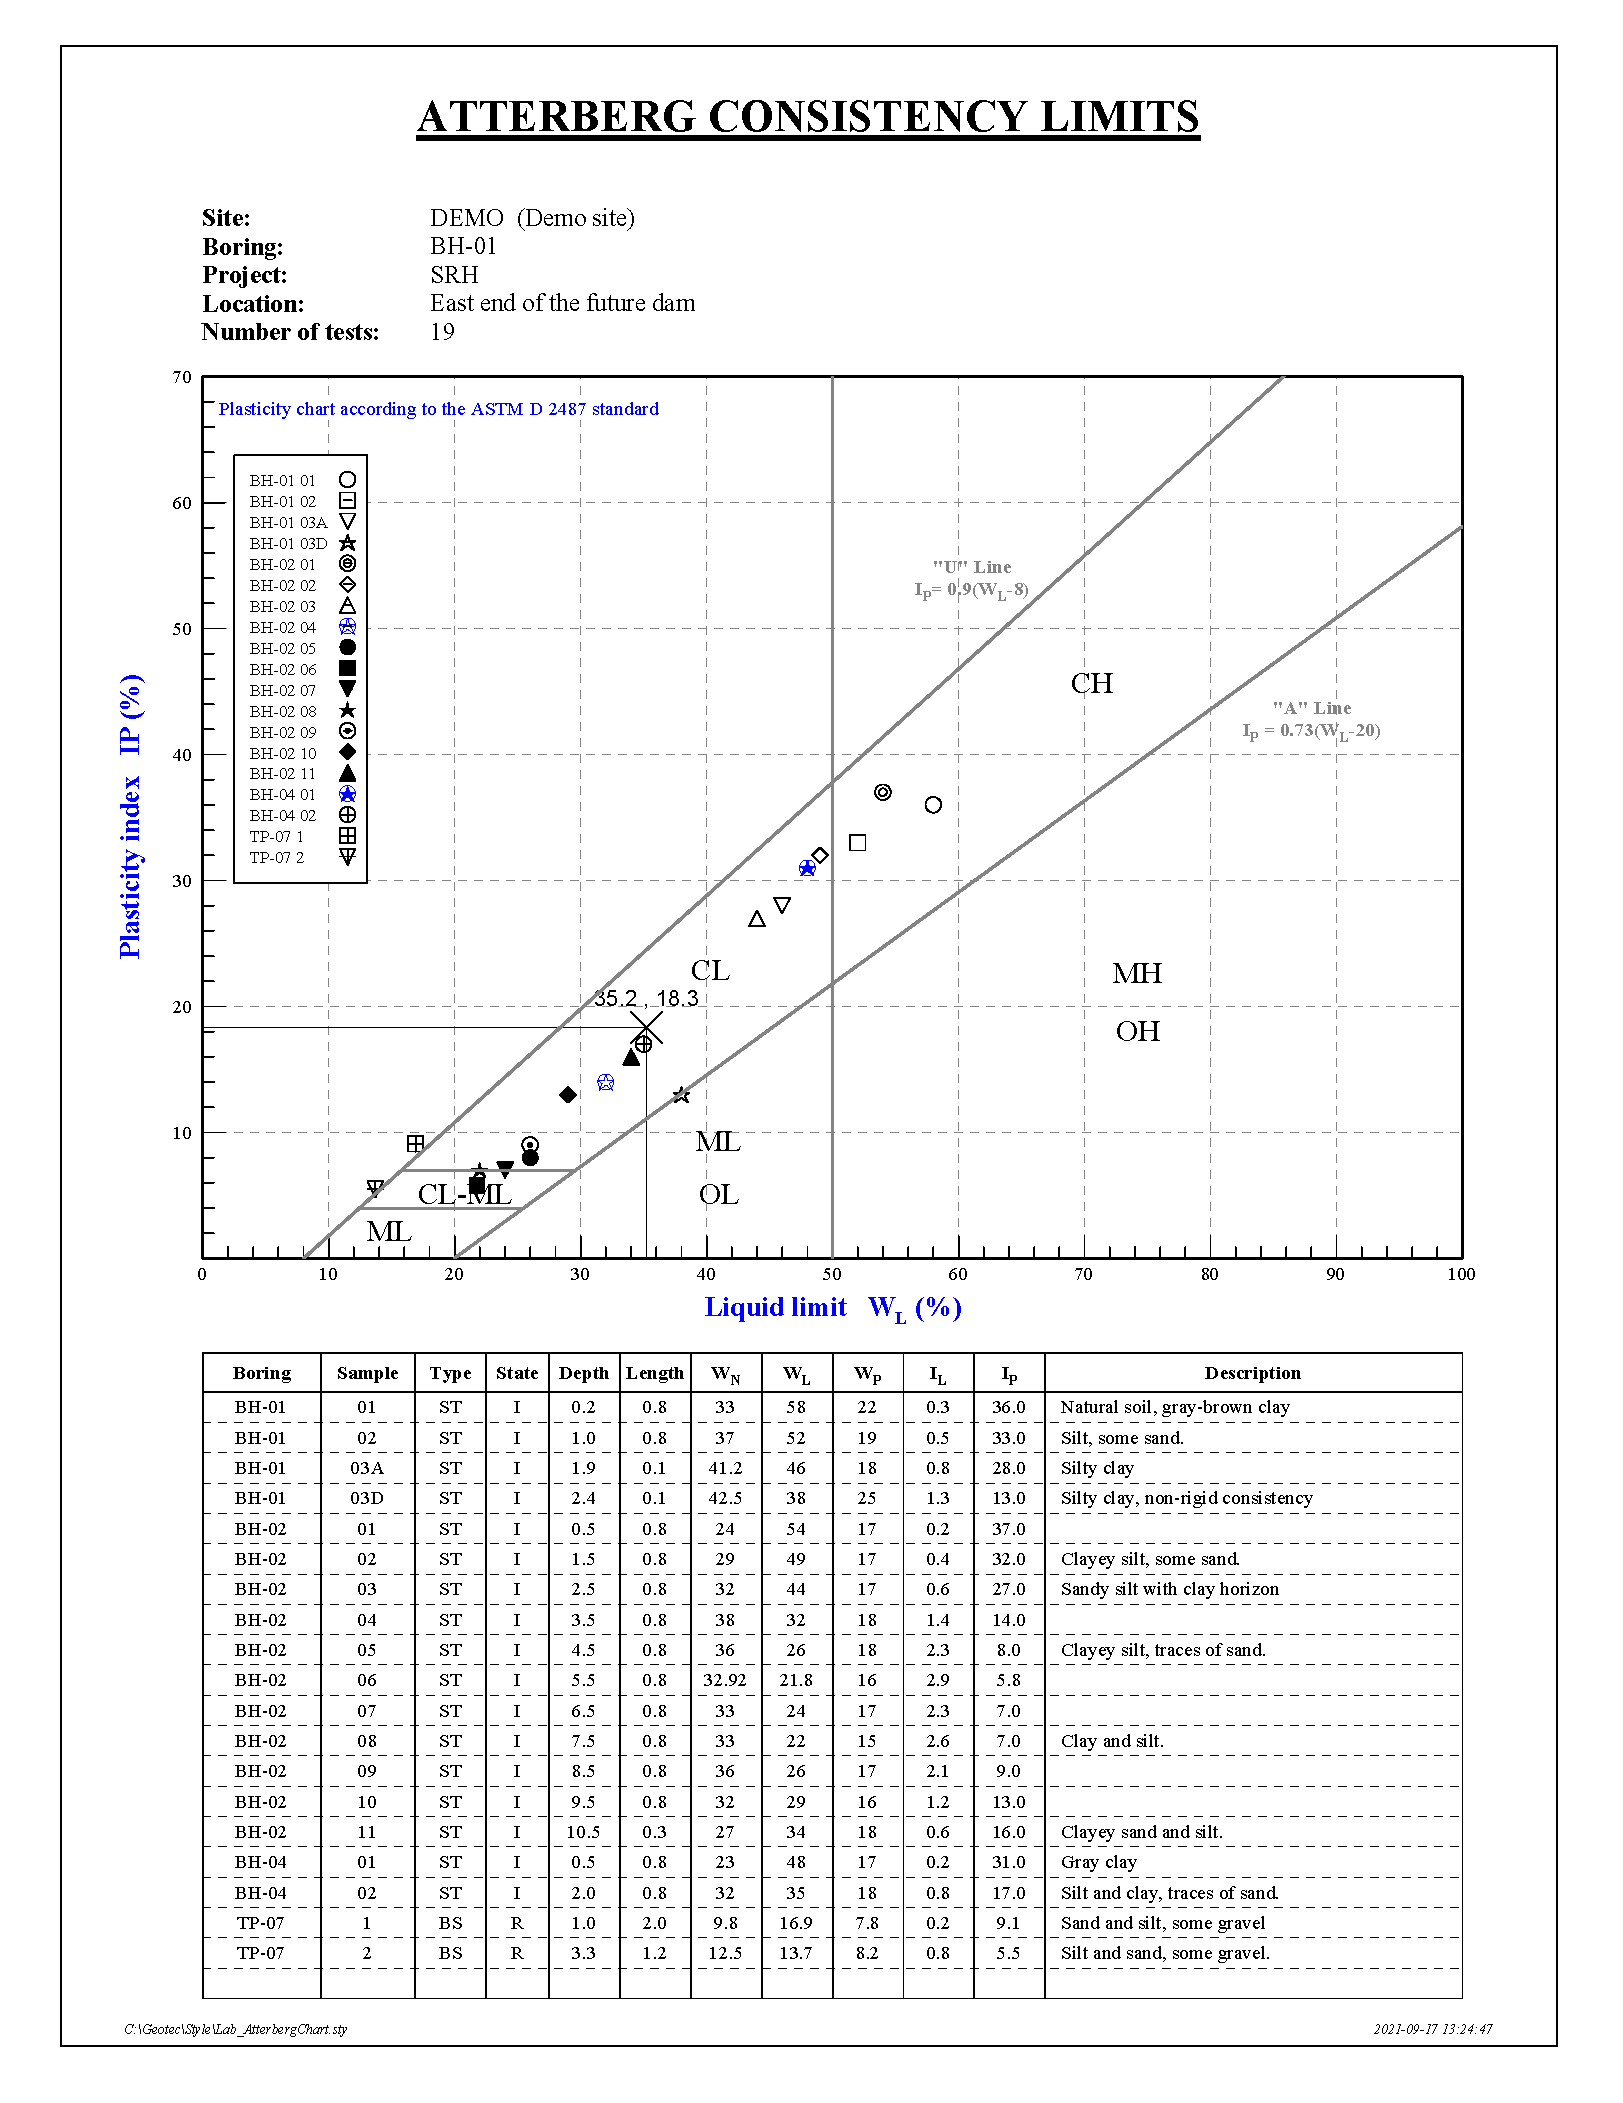
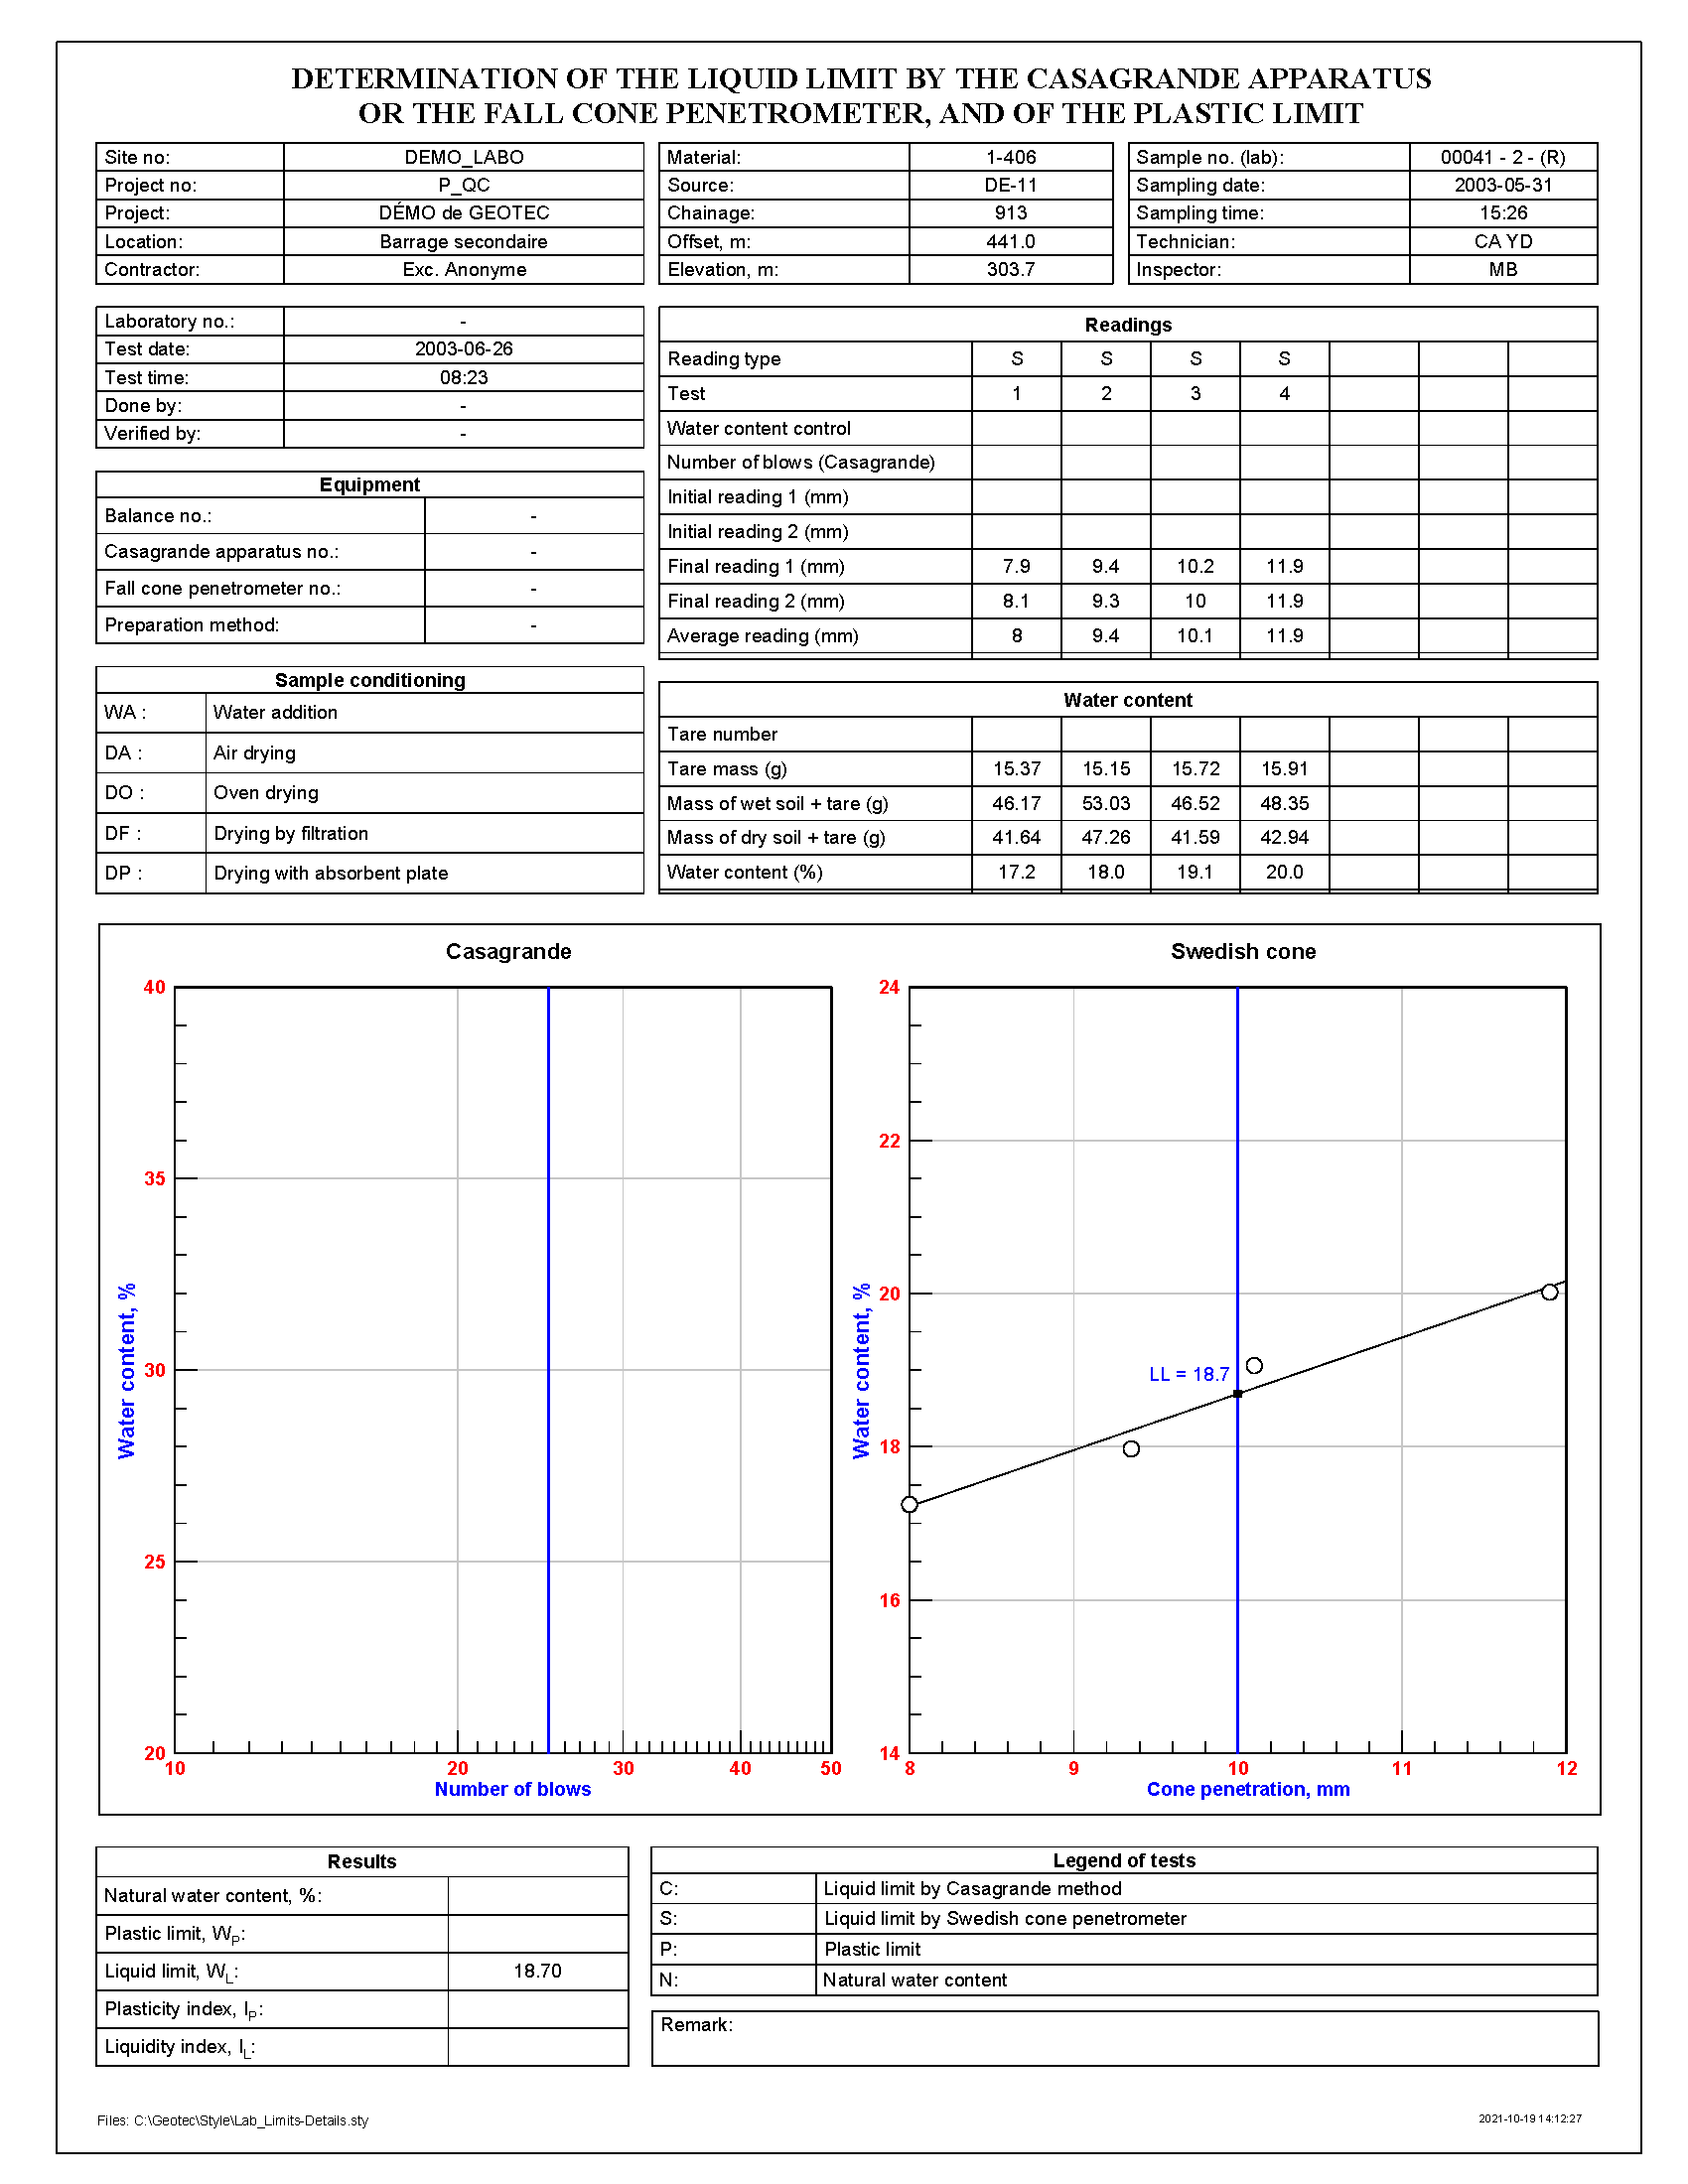
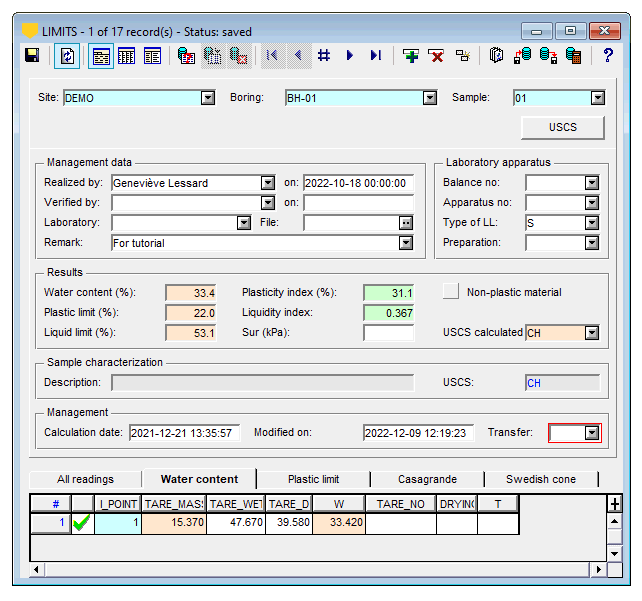
Atterberg limits and natural water content
Geotec is used to calculate the natural water content and the Atterberg limits of a soil sample.
In Lab, display the Atterberg chart as well as the graphs used to determine the liquid limit.
- Entry of masses to determine the natural water content and plastic limit
- Entry of masses and of number of blows for the liquid limit via the Casagrande apparatus
- Entry of masses and of penetration measurements (mm) for the liquid limit via the Swedish cone penetrometer
- Calculation of an average if several tests are done
- Geotec calculates WN, LL, PL, IP, IL and USCS

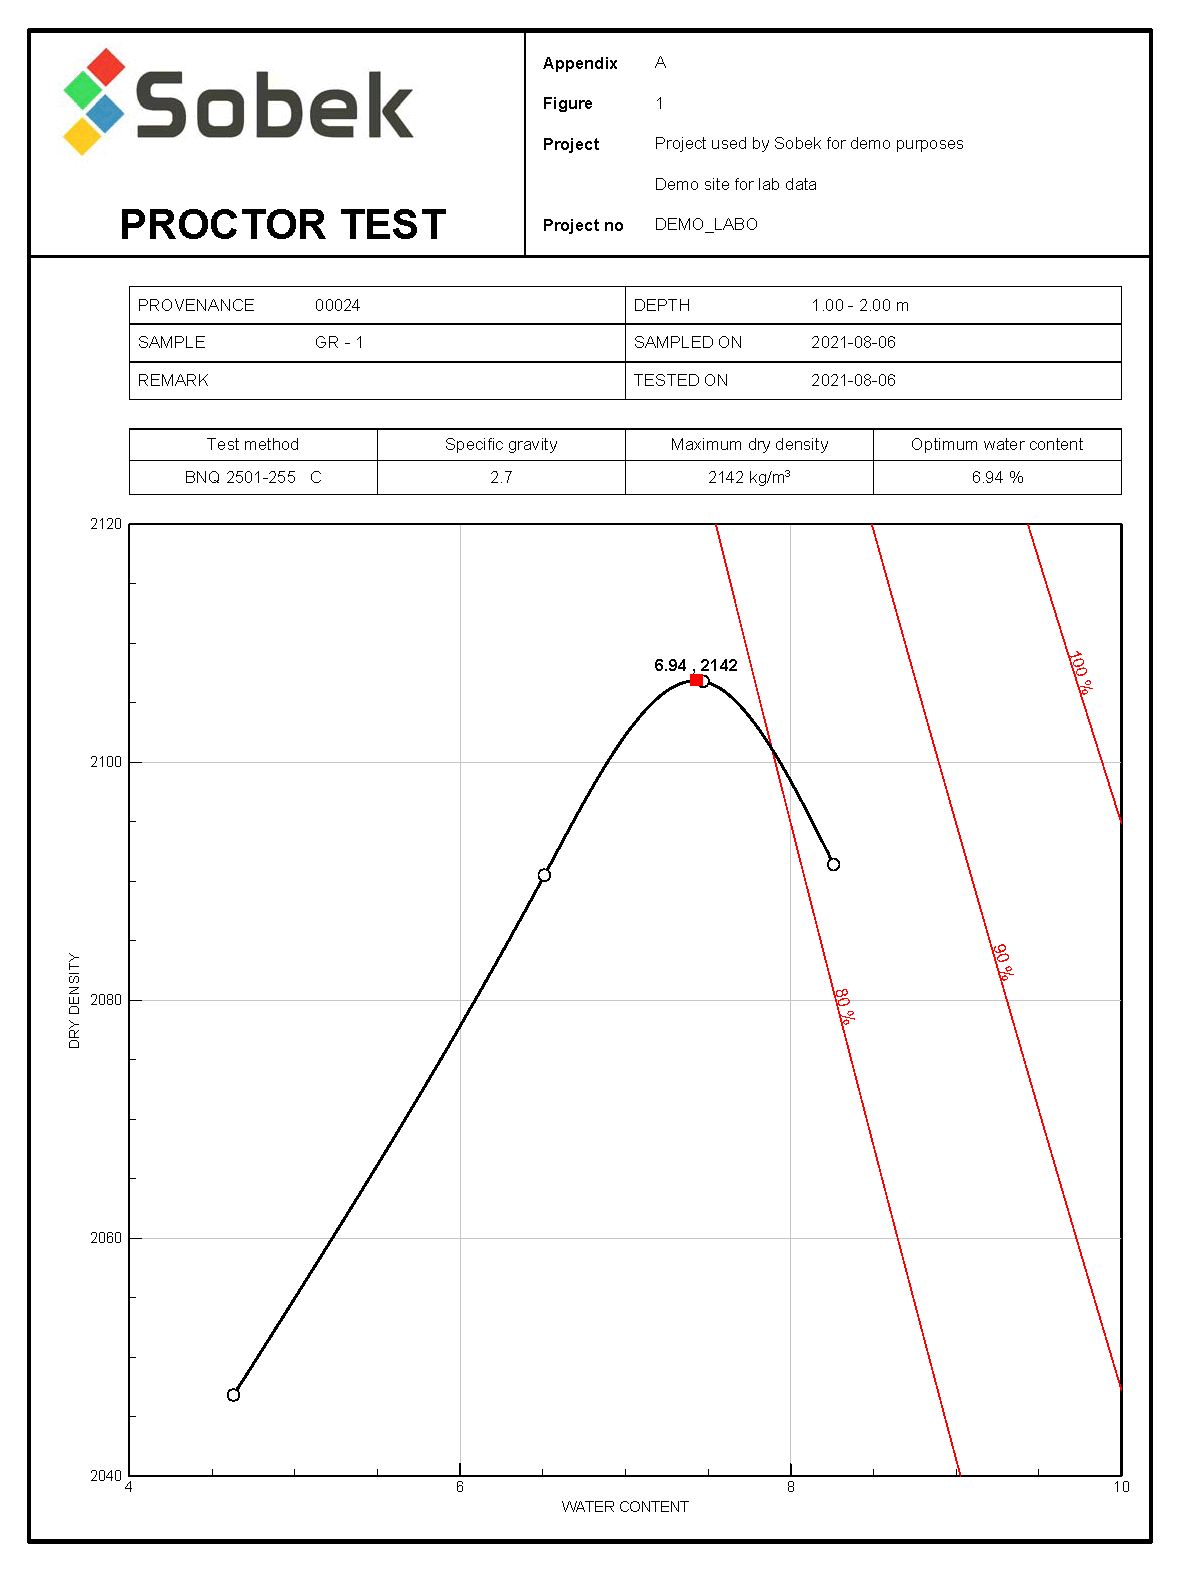
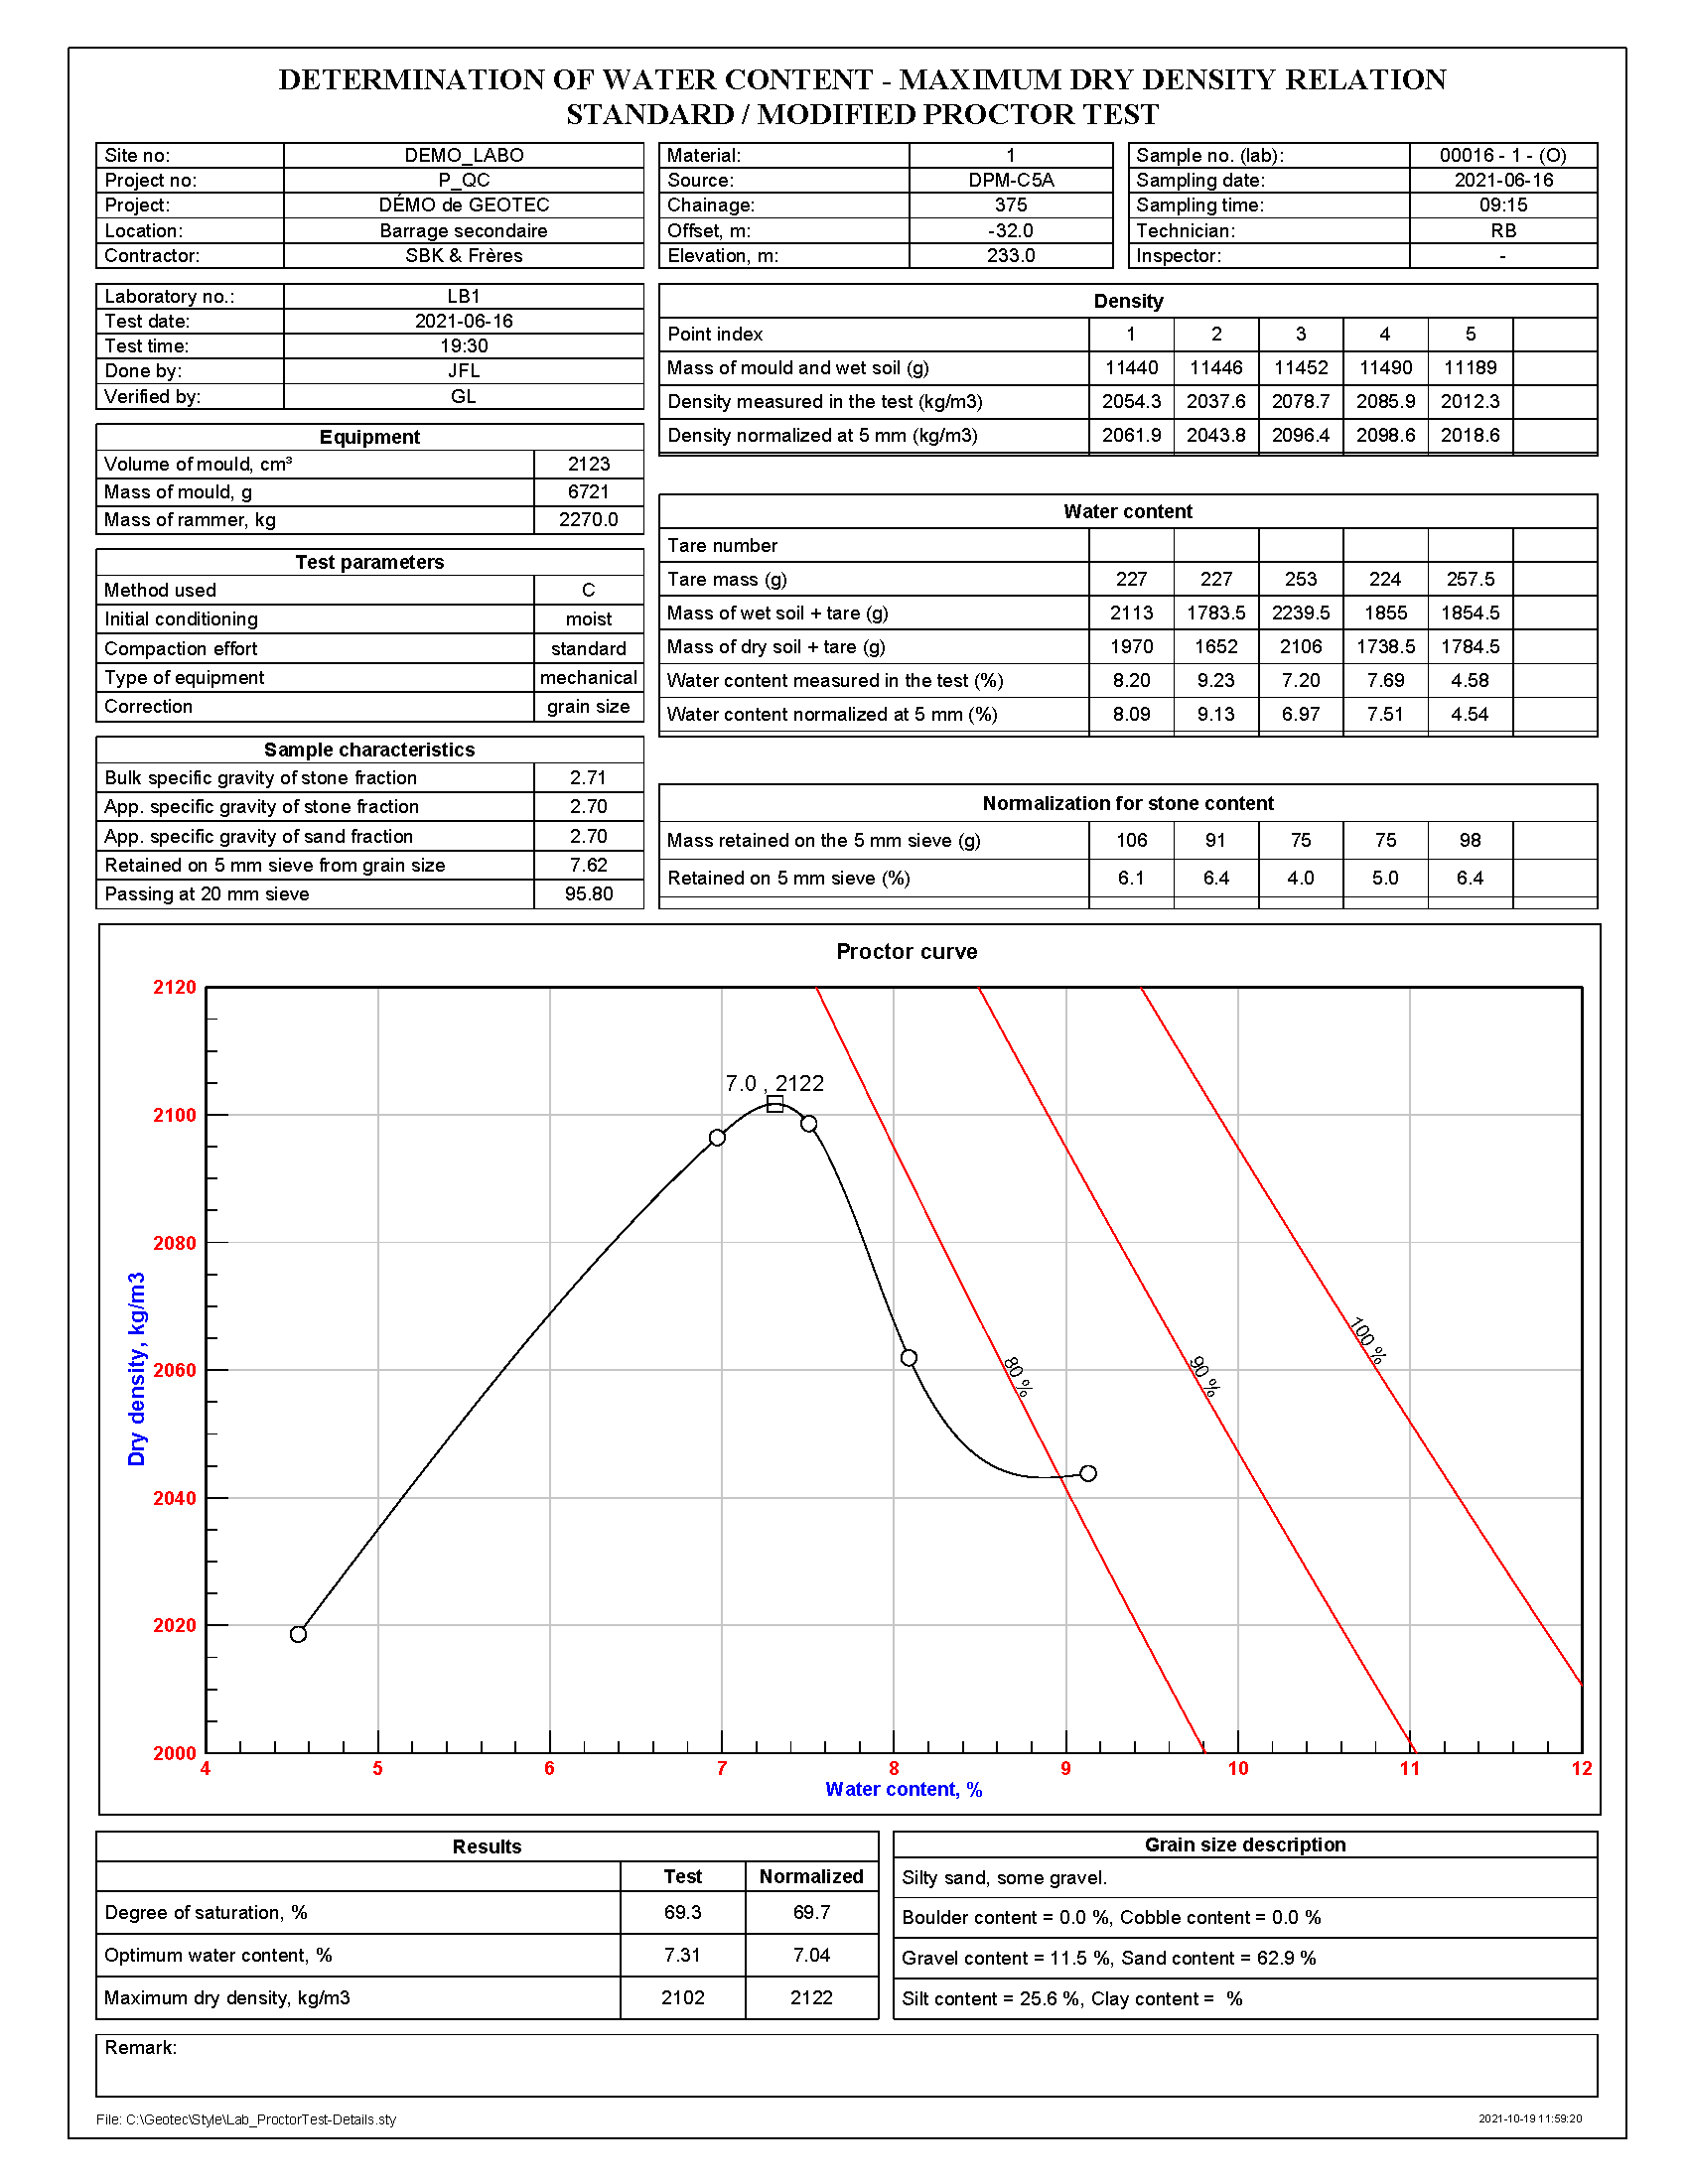
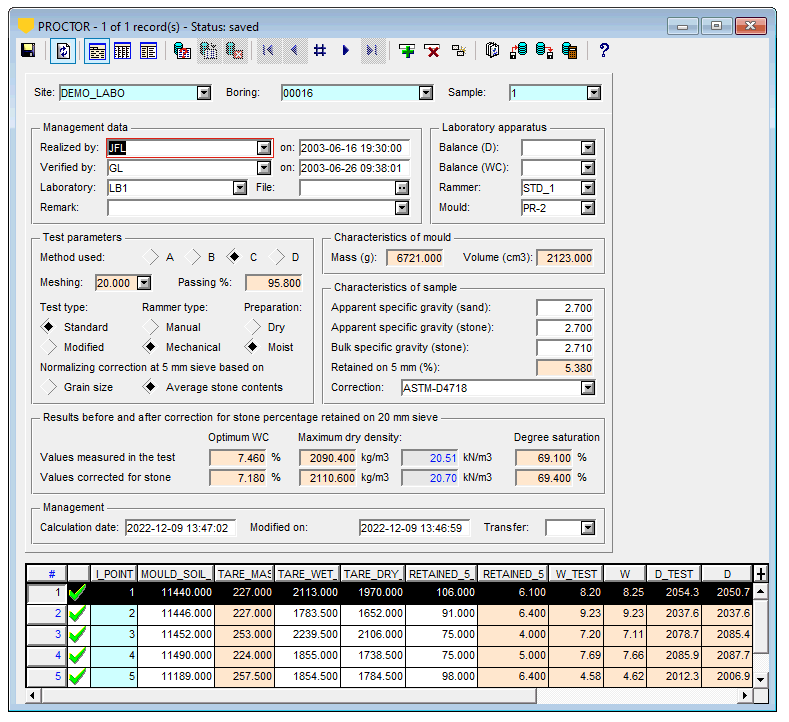
Proctor compaction test
Geotec is used to calculate the results of Proctor test for the determination of the water content – dry density relationship.
In Lab, display the graph of density as a function of water content and identify the optimum. You can also add saturation curves.
- Entry of masses for the calculation of W and Density per point
- Normalizing correction at 5 mm based on grain size analysis or average retained percentage at 5mm sieve
- Correction of the optimum for stone content at 20 mm
- Geotec calculates the optimum water content and the maximum dry density

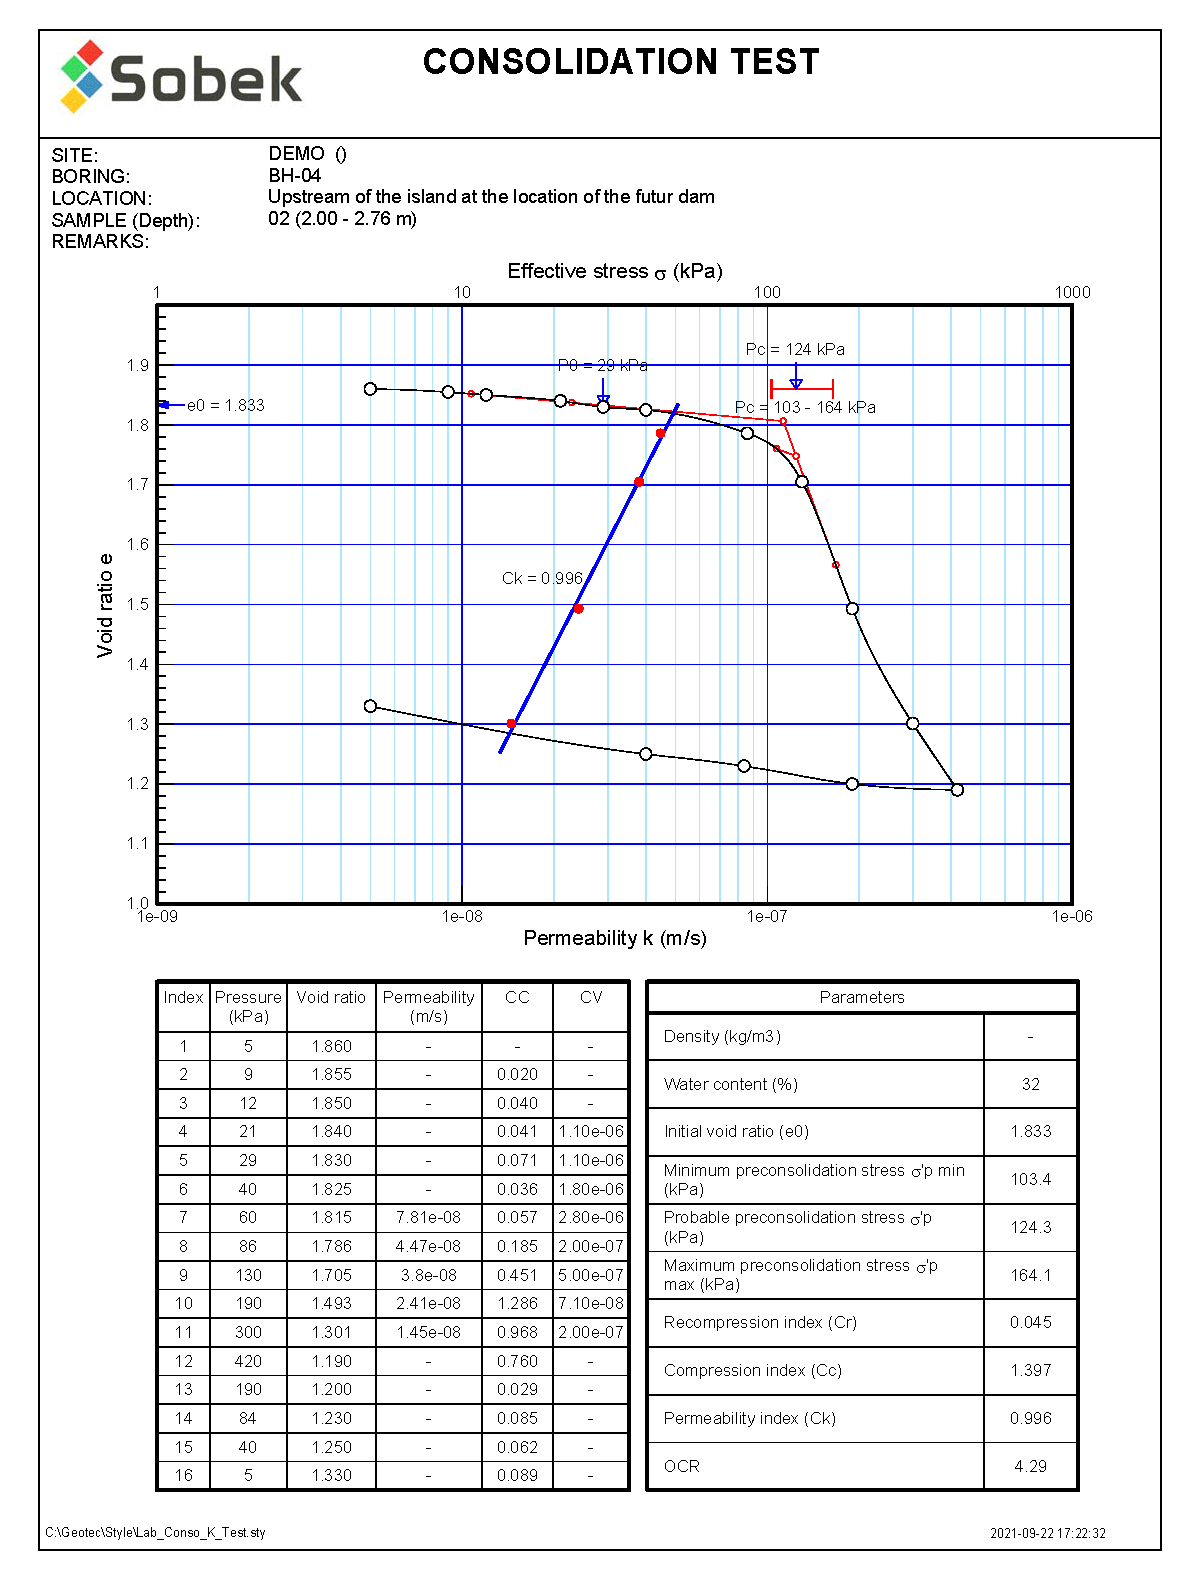
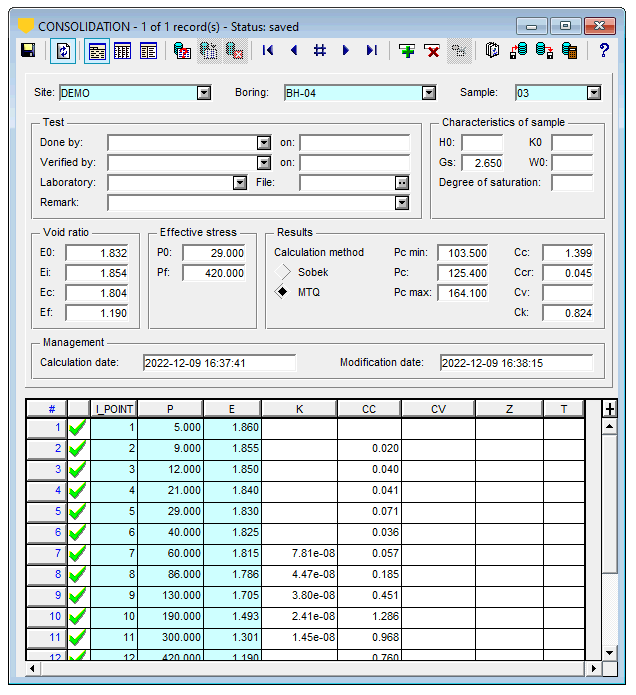
Consolidation test
Lab is used to calculate the results of consolidation and permeability tests.
In Lab, display the graph of void ratio as a function of pressure, as well as the graph of void ratio versus permeability.
- Entry of void ratios and pressures
- Entry of permeability at various pressures
- Geotec calculates the minimum, probable and maximum preconsolidation stress based on 2 methods
- Geotec calculates Cc, Ccr and Ck
