The Pro module is used to produce profile views showing borehole data. You can create cross-sections to visualize the geotechnical, environmental, or geomechanical properties of boreholes projected onto a georeferenced outline. A new feature has been added to integrate seismic line data into profiles.
Seismic line data
The geophysics measurements are entered in the Geotec database in order to visualize them on a profile view.
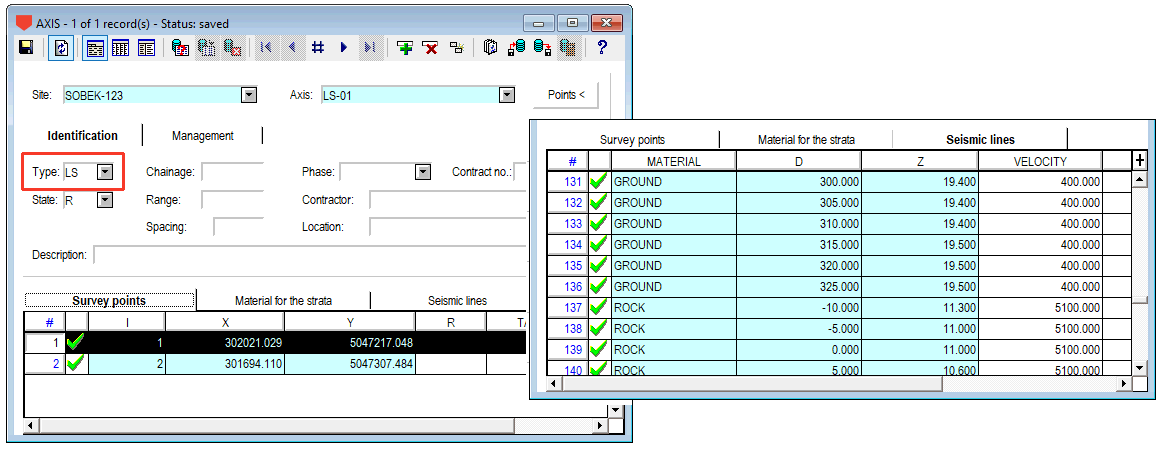
For each seismic line, we must define its site (or project), its number, its type as “LS” as well as the X, Y coordinates of its implementation points, at least the first and last points. These coordinates must be entered in the coordinate system (MTM or UTM), NAD (27 or 83) and zone defined for the site. The coordinates will allow the seismic profiles to be projected correctly on the main outline.
For each material interpreted from the test (defined in the 2nd tab), the profile is defined in the Seismic Lines tab with its distance (0 being for the geophone at the 1st implementation point), the elevation and the measured seismic velocity. Profiles of several materials can be defined.
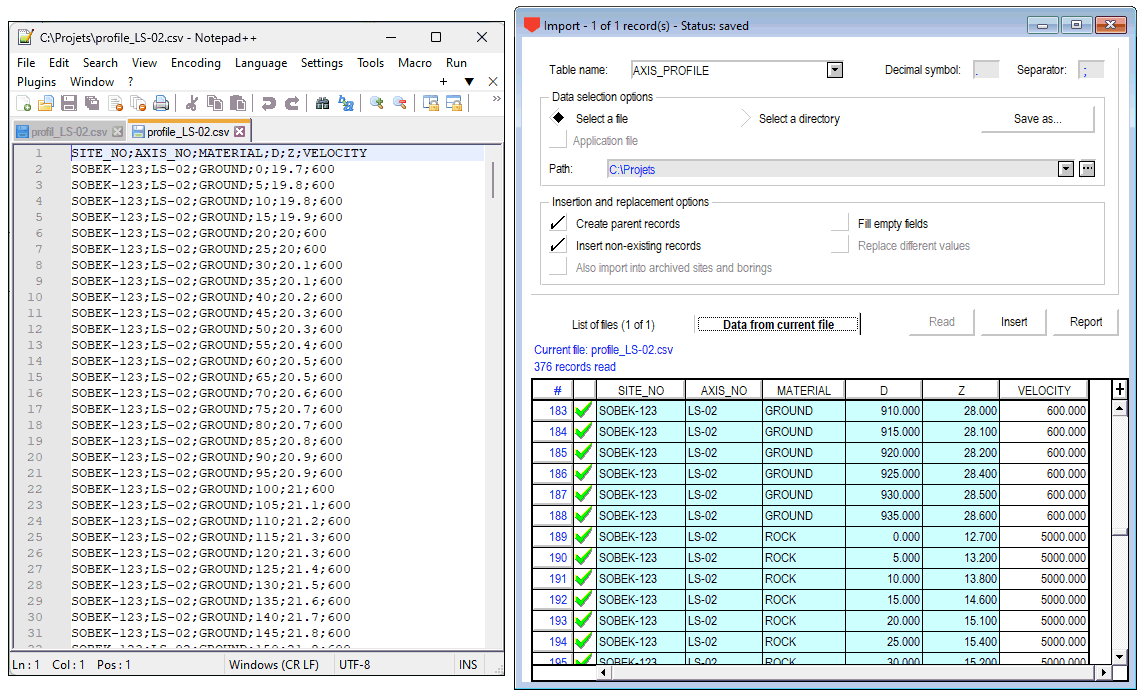
CSV import
Data from geophysics tests can be imported via a CSV file. The headers must be the same as the field name: SITE_NO, AXIS_NO, MATERIAL, D, Z and VELOCITY. The materials for the strata will be automatically created with the option Create parent records.
Options
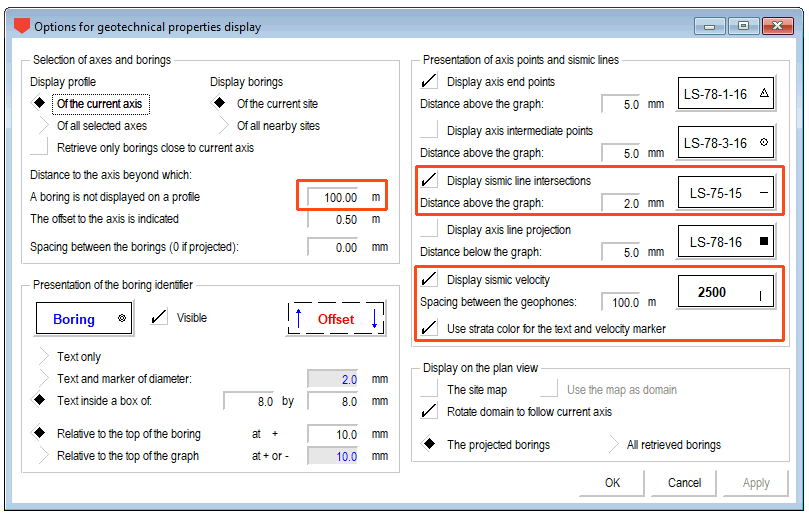
To project seismic lines, activate the option “Display seismic line intersections”. In addition, make sure that the type for the seismic lines in the Axis form is set to “LS”.
You can adjust the distance of retrieval. Like for borings, any part of the seismic line outside the distance of retrieval will not be displayed on the profile.
The seismic velocities can be displayed.
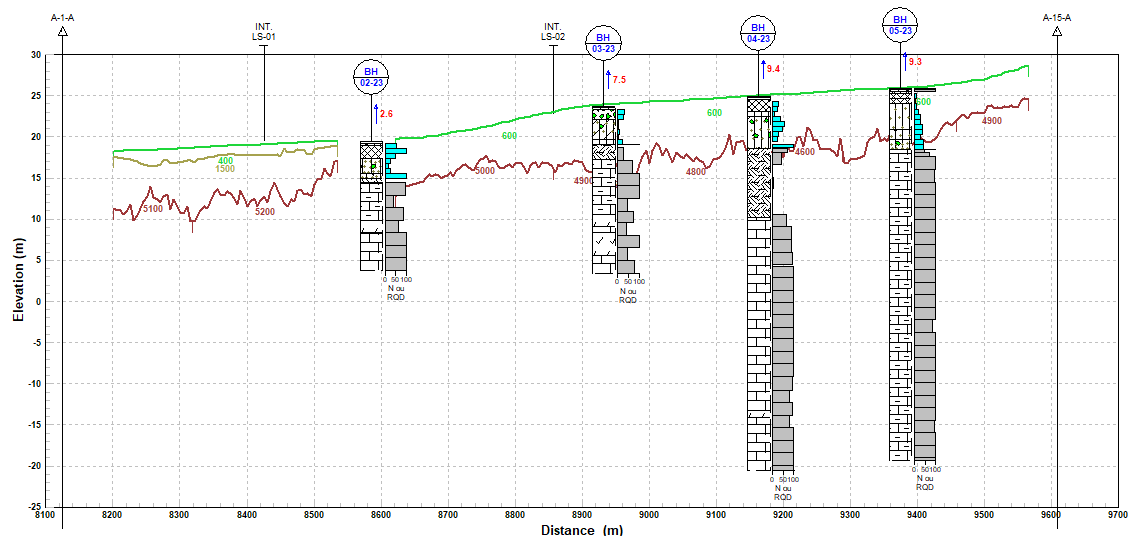
Displaying the profile
When seismic lines data are integrated in Geotec and the main axis is defined, either manually, via CSV import or via Google Maps (see the Pro tutorial), do a query to retrieve the axis and visualize the borings and seismic line data in the profile view.
Graphic display
When a seismic profile exists, it is displayed with the color associated to the material, or in black if no color is defined (see the Materials entry form). You can also assign a color to the material via the curves editing window of the PROFILE graph.