Piezocone penetration testing (CPTu) is an in situ geotechnical investigation method used to assess mechanical and hydraulic properties of soils. It has the advantage of being a fast, continuous, and reliable test that does not require soil sampling, making it widely used for geotechnical and geoenvironmental soil characterization.
CPTu testing measures tip resistance, sleeve friction and pore water pressure continuously at short depth increments. Additional sensors can measure seismic velocity, electrical soil resistivity / conductivity, among others.
CPTu testing is used to:
- Identify soil types (clay, sand, silt, etc.) and stratification,
- Evaluate soil strength and stiffness, including consistency or density,
- Estimate geotechnical parameters such as friction angle, undrained shear strength, and deformation modulus,
- Assess soil permeability and consolidation behavior, especially in fine-grained soils (through pore pressure dissipation tests),
- Provide data for design purposes in foundation engineering, embankments, levees, and infrastructure projects.
Geotec offers comprehensive integration of CPTu measurements, calculations and SBT interpretation, and graphical representation, allowing users to import raw data, perform geotechnical interpretations, and visualize results alongside boreholes and other site investigations.
Input data
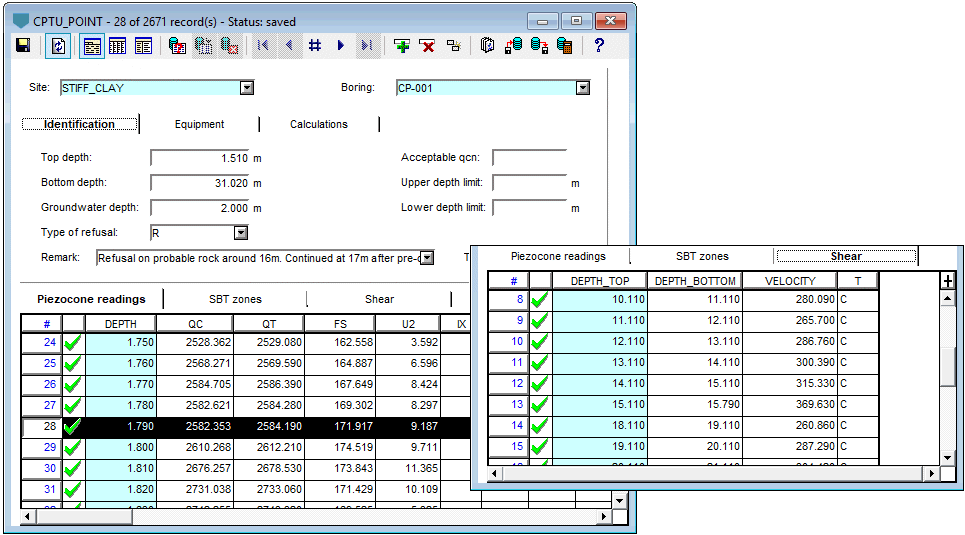
The basic CPTu input data include the tip cone resistance qc or the cone resistance corrected for pore water pressure qt, the friction resistance fs, and pore water pressure u2 at specific depths.
Values of qc (or qt), fs and u2 are expected to be in kPa. Temperature and inclination in X and Y direction can also be added if measured – and plotted through Geotec.
Geotec supports both imperial and international systems for depth measurements. Depths will be considered in feet if the project unit system is IM, and in meters if the project unit system is SI. The rest of the units are currently in SI and specified in the header of each column.
For RCPTu, electrical resistivity or conductivity can be inputted, the other value being calculated by Geotec. For SCPTu, shear wave velocities for depth intervals can be inputted into the seismic CPTU table.
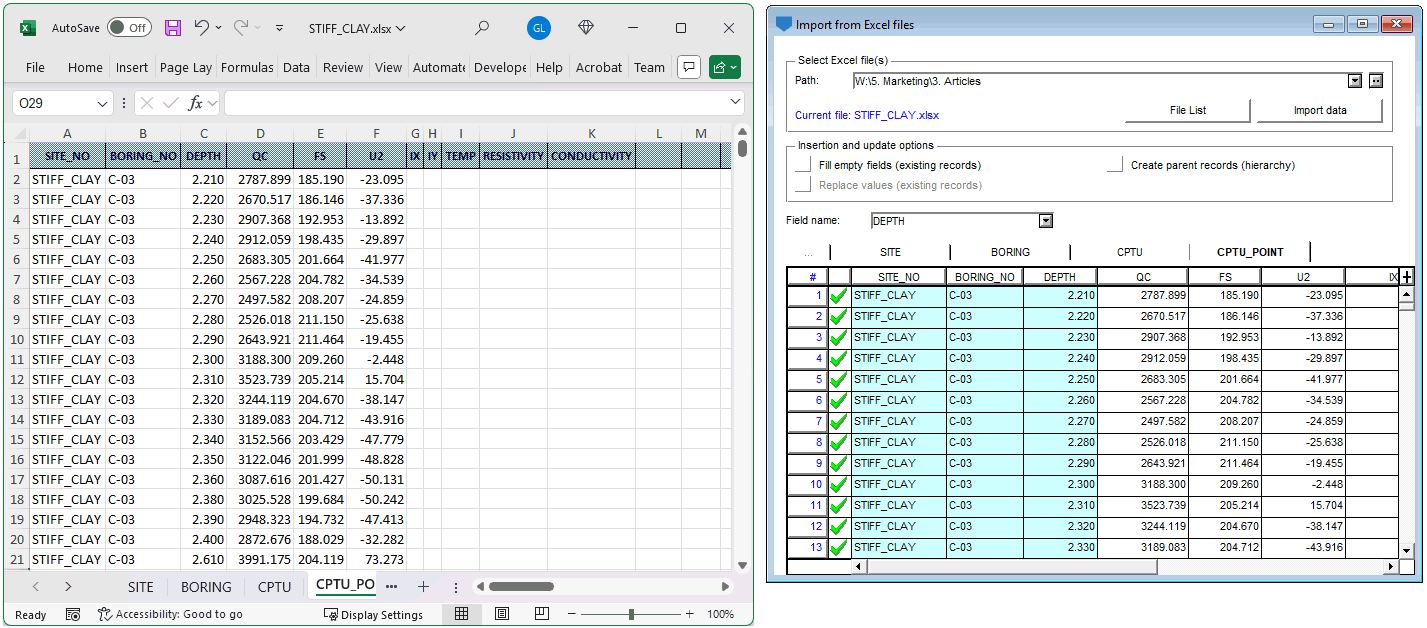
CSV or Excel import
Piezocone testing measurements can be easily imported from a CSV or Excel file. The values must be defined as columns, and headers matched to the field names – mapping can be done directly in Geotec. Additional options are available such as the automatic creation of parent records in the database (for hierarchy).
Through Excel, multiple tabs can be imported at once. Information specific to the CPTu test can be imported, such as Probe and Tip used, cone diameter, etc.
DRF import
Other formats such as DRF files produced by Vertek drills are also supported. With DRF files, many values from the file header are automatically inserted upon import, such as List of technicians, data and time of test, and probe number.
Calculations
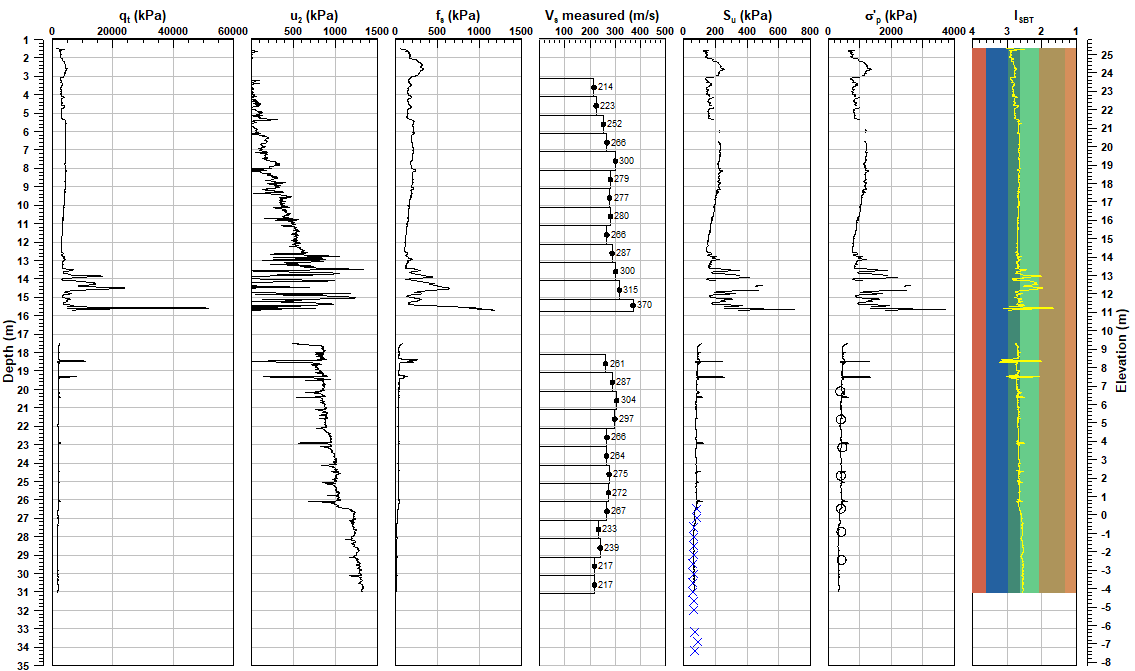
Geotec uses established empirical correlations to estimate geotechnical parameters, based on the theory of Robertson et al (1986) and Robertson (1990). Geotec also predicts Soil Behavior Type (SBT) based on six different charts. Methods used for the interpretation of the piezocone test and the empirical and theoretical equations used to determine the various properties are described in detail in our documentation. Some 30 geotechnical parameters are calculated and can be plotted.
CPTu Parameters
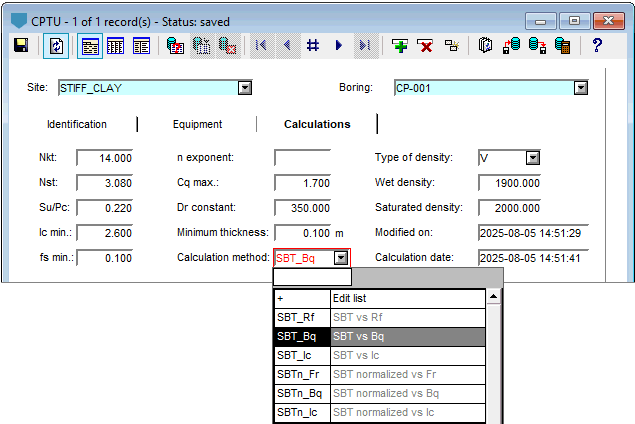
Many coefficients are used on the empirical correlations and vary based on soil type and structure and other factors. Geotec used default values for each CPTu test, but these can be modified.
Parameters can be adjusted for each test. They include:
- Nkt and Nst constants
- Minimum Ic value for su calculation (undrained shear strength)
- Minimum value for fs (sleeve friction)
- Calculation method to determine SBT zones
- Minimum thickness to create said zone
- Density can be constant (above and below groundwater depth), calculated at each depth or taken from the corresponding stratigraphic layer.
Hydrostatic vs non-hydrostatic porewater pressure
By default, Geotec assumes that equilibrium water pressure is hydrostatic relative to the ground water depth. A plot of the hydrostatic profile uh can be presented.
If a non-hydrostatic profile is assumed, equilibrium water pressures u0 can be inputted at various depths and the profile of u0 used for calculations.
Graphic boring reports in Log
As for all boring logs, any property that changes with depth can be plotted via your style file in the Log module by using these steps:
- Add a column for your data.
- Insert a column named:
- CPTU_POINT – for specific CPTu measurements or calculated parameters
- CPTU_ZONE – for calculated SBT zones
- CPTU_SISMIC – for seismic velocity data
- Set the left position and width of the column in mm.
- Insert a column named:
- Configure the column
- Choose the parameter to plot (qt, fs, u2, Bq, su, etc.) from the drop-down list
- Format the display:
- Set the type: typically to polyline
- Choose line color and thickness
- Adjust the X-axis
- Let Log automatically adjust the axis limits based on the data (via Rounded), or
- Set fixed axis limits for consistency across all logs
Once the style is set up, it can be reused for any project. Simply query the database to retrieve the piezocone and it will be ready for viewing and analysis.
Additional options
To enhance analysis and correlations, Log includes an option to overlay multiple piezocone in the same report. By checking this option, query a project with specific CPTu’s and superimpose them to view trends. Each CPTu is represented by a different color for easier analysis.
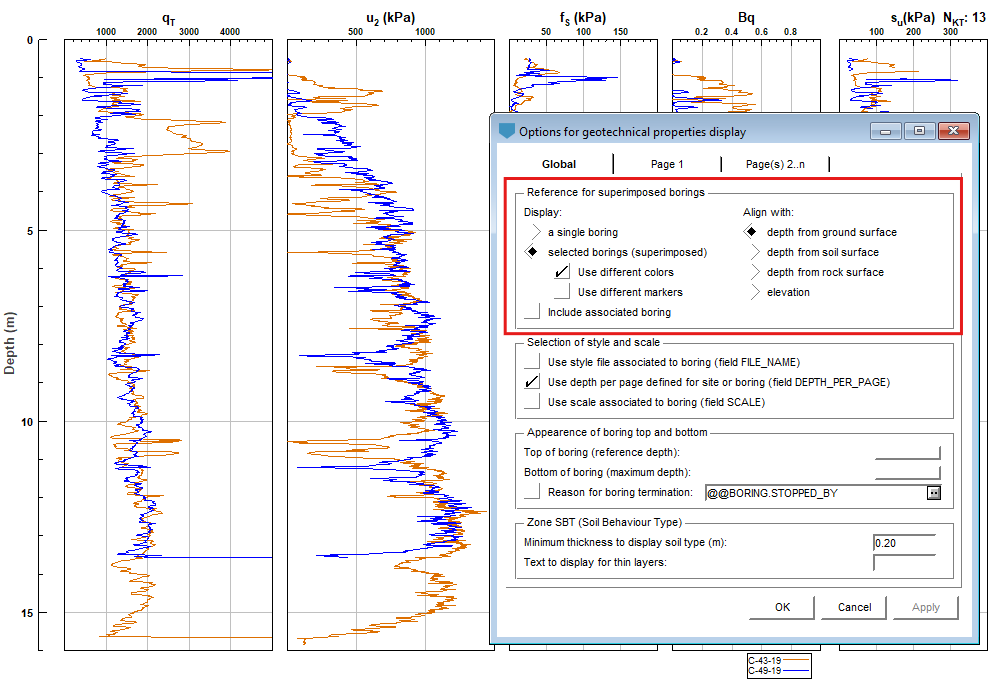
It is also possible to display data from a borehole associated to the CPTu, which is typically adjacent. Then, you can present both CPTu test parameters and lab / in situ tests results from the associated boring and establish correlations or validate your results.
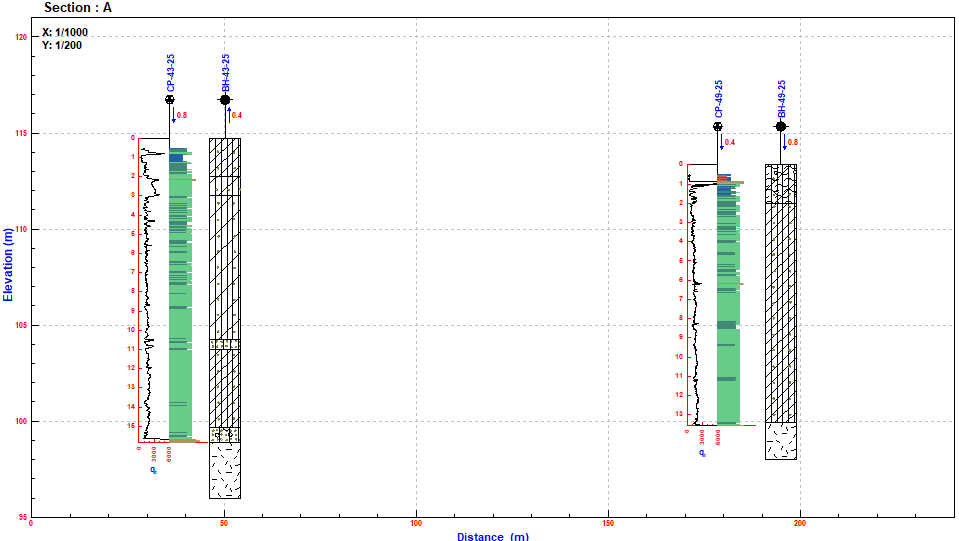
CPTu data in Pro
CPTu data can also be presented via the Pro module on cross-sections. Establish the X and Y coordinates of the intersection points of your outline. Then, by querying this outline, the cross-section is generated and presents borehole properties projected onto that outline.
It is possible to select the columns to display, just like in Log. For example, display a CPTu measurement and / or calculated properties, and also present the stratigraphy identified in boreholes, to obtain a clear understanding of the underground.